 Slashdot Mirror
Domain: carbonbrief.org
Stories and comments across the archive that link to carbonbrief.org.
Comments · 52
-
Re:How about getting your story to be consistent?
This article says the opposite, https://insideclimatenews.org/... with China slightly lowering its emissions over the last 4 years while America is back to increasing them.
Unluckily it is really hard to find good info,as this article makes different claims, https://www.carbonbrief.org/an...
Still, why don't you just say the rest of the world outputs more carbon then the relatively small USA so everyone else has to stop why we continue to burn shit like crazy -
Re:contaminated the groundwater in 48 states you m
In actual-reality America the vast, vast mass of toxic fly ash sits unused in huge piles alongside rivers and other waterways, and has contaminated the groundwater of all 48 lower states. https://www.grandforksherald.c...
Well that comes down to regulations and enforcement of those regulations however when it comes to climate change https://www.carbonbrief.org/ma... paints an interesting picture. Instead of complaining about the converted western countries who are clearly closing plants to their own economic detriment to appease the climate change brigade. Why don't those same people go protest in countries who are building more coal fired plants and tell them what they are doing is bad for the planet. And note:- those countries have far fewer regulations and even less enforcement than the EU and US and other western nations. Just wait till that catches up with the planet.
-
Re:Yet Another Doomsday Prediction
The problem here is that studies like this are based on *simulations* not observations of repeatable experiments.
You are talking about two different things here, and I think it's worth clearly disentangling the two.
One is the specific paper being discussed here, which proposes a new feedback mechanism that operates only at high carbon dioxide concentrations, much higher than those in the present era. This one is indeed a simulation, and the authors themselves emphasize that it is speculative and needs to be studied further. In particular, this feedback mechanism may have applicability to understanding paleoclimate events.
but you seem to go on to be to take a pot-shot at climate science, and climate models in general.
What we have here is a set of theories, which really cannot be proven beyond doubt.
Science doesn't, and can't, "prove things beyond doubt."
What science really does is make models (what the general populace calls "theories"), and then test the models against measurements. The models that explain the measurements better are kept, and the ones that don't are discarded. A scientific theory is never "proven beyond doubt"; in real science, every model is subject to being discarded when a better model comes along, or when new measurements are made that the old model can't explain.
Science is really a process of progressive iteration: the models get better and better as we understand more.
If we are being honest here, climate change science is, at best, an educated guessing game, not a proven beyond a doubt set of scientific laws, and specifically I mean "man made climate change."
Here is where you switch from discussing the paper in question, and go on to take pot shots at climate science.
Unless you mean "all science is at best an educated guessing game", no. The basic points of climate science, and specifically "man made climate change," are well understood, and well supported by evidence. The basic physics has been known for over a century, the basic model is over fifty years old now and well supported by evidence. The detailed models are working at accounting for details at progressively finer scales, but the basics are well understood.
The critics of this science have some valid points.
The main (or at least the loudest) "critics" of the science in the past have consisted almost entirely of people whose "science" is driven by ideology and funded by fossil-fuel companies, and they have proven to be wrong so many times over and over that their main problem is nobody takes them seriously. If they have "some valid points", those points have been so overwhelmed by the tidal wave of ideologically-driven garbage that they are entirely invisible.
Past high profile predictions of our demise from climate change have been wildly over blown,
When you talk about "high profile" predictions, I think you're now moving into yet a different rant, which is a critique of media coverage of the science. Ignoring what the media considers "high profile", the actual predictions done by real science have, so far, mostly been accurate.
there seems to be a bias towards "making news" in order to get research grants,
You are confusing the science with the media attention. The paper in question is a good case in point. Notice how the headline on the article is "Extreme CO2 levels could trigger clouds ‘tipping point’ and 8C of global warming"-- that's "making news". And then read the actual paper, which has a single sentence talking about the possibility of this happeni
-
30 years ... ?
Climate scientists tell us that the world must drastically cut its fossil fuel use in the next 30 years to stave off a potentially catastrophic tipping point for the planet
If you actually plan on replacing most or all of the electrical production facilities and vehicles world wide without a large military taking over the world and dictating policy to every nation , I'm afraid you will be disappointed.
Not that I oppose the idea of getting rid of dependence on fossil fuels, but if you plan on producing approx 1 billion passenger cars ( and somehow forcing people to scrap the existing ones). http://www.worldometers.info/c...
Replacing nearly 900,000 power plants https://www.carbonbrief.org/ma...Replacing 2 to 3% of the global economy https://www.investopedia.com/a...
My guess would be you are already way behind, regardless of what method you choose because you first have to convince those in control to take action on a massive scale and most of them are no where near doing that.
So IF the first preposition is correct ( and I hope it's not), there isn't much hope of going beyond that tipping point. If the chaos and wars it generates doesn't lower our carbon output , we will probably fix the problem over the coarse of 100 years or so.
-
Re:Daily Bullshit
That's an expected part of a natural cycle you asshat, even WaPo could tell you that:
https://www.washingtonpost.com...
But apparently you only read and mindlessly parrot climate conspiracy blogs. And even with this cooling, 2018 is on track to be the 4th hottest year on record:
-
Re:Daily Bullshit
-
Re:Was Article Summary run through google translat
Carbon taxes etc, would put nuclear on stronger footing.
Nope. Nuclear may have much lower lifetime carbon emissions than fossil fuels, but they're still vastly higher than PV or wind. Carbon taxes would be the final nail in the nuclear coffin, since PV and wind are already cheaper than nuclear.
-
Re: What is the correct temperature
Please, please keep educating yourself about this:
https://www.carbonbrief.org/ex...
The first link you have up there is for the US southeast which is a noisy outlier in temperature trends compared to the global climate. Southeast US trends are not representative of the world.
Those temperature adjustments made by NOAA are tiny compared to the scale of the temperature rise over the past 40 years (see link above). And they result in *less* cooling since 1900 instead of more.
-
Yawn... look up sources.
Your article comes from CoalSwarm.
CoalSwarm, a global network of researchers tracking fossil-fuel infrastructure, analyzed satellite imagery as of July 2018, and discovered that the construction of around half of those 150 plants is still proceeding, despite the government orders.
Just like that OP NYT article, which sources Urgewald, which again, sources CoalSwarm Database.
We also included companies listed in the CoalSwarm Database as they are planning new coal power plants.
Getting that? Got that? Good.
Now go read the very first line in the link I quoted above, debunking those numbers. Well... putting them in context.
It goes kinda like this...Dr Christine Shearer is a researcher and analyst for the US-based energy research group CoalSwarm.
The stuff you're quoting is accounted for - AND THE COAL PLANT NUMBERS ARE STILL DECREASING.
As for this...
U.S. Exports expected to be up 60% in 2018 go figure.
Again... actually reading the article and looking up sources helps to put things in context.
(Montel) US seaborne thermal coal exports could surge 60% this year amid a shortfall in global supply and healthy import demand, the director of consultancy Perret Associates told Montel on Wednesday.
Guillaume Perret estimated the country's coal exports could rise from 36.7m tonnes in 2017 to 58m tonnes this year and 60m tonnes in 2019.You are relying on predictions of a consulting firm which lives and dies with coal. So take that in consideration when you ask yourself if they are biased.
https://www.perretassociates.c...Now scroll down to the bottom of the text where they try to sneak past the ugly truth.
Meanwhile, he said domestic coal demand in the US "will be flat at best, or erode slightly" over the coming years.
And demand from Europe is also on the wane, with the EU-15 countries expected to import just 90.2m tonnes of seaborne thermal coal this year versus 107m tonnes last year.I.e. Even people selling you coal are admitting, though "hiding" it in last lines of the text, that the demand for their product has peeked and is on decline.
-
Re:Smart Move
Nor has China which is still building new coal plants
Except the actual and up to date source of the info in your article points otherwise.
https://www.carbonbrief.org/gu...Planned new coal capacity has been cancelled around the world, with particularly rapid falls in China and India.
At the end of 2015, China had plans to build 515GW of new coal capacity. That figure now stands at 76GW. In India, the pre-construction pipeline has shrunk from 218GW in 2015 to 63GW today.That's the main reason Chinese companies are scrambling around the world trying to sell their coal plants.
They already had them in the pipeline and now they can't just scrap billions of dollars already built into steam turbines.
So they are trying to get rid of them elsewhere while there's still time.Coal is simply no longer economical.
Most notably, our figures show that less than 2GW of new coal capacity has been proposed in either China or India in 2018 - a significant development for the two countries that have been the site of 85% of the world's new coal power capacity since 2006.
While some analysts predicted the drop in China and India might be replaced with an increase throughout other parts of the world, the pipeline across the rest of the world also continues to decline.
Notably, Japan has called off 3.6GW of proposed coal capacity since 2017, while South Korea will stop issuing permits for new coal plants.
From January through to June 2018, nearly 20GW of new coal capacity was commissioned: 12GW in China (blue area in the chart, below) , 5GW in India (red), and 3GW in the rest of the world (South Africa, Pakistan, Vietnam, Philippines and Japan).
While significant, the amount of coal power capacity that began operating during the first half of 2018 (20GW) was nearly matched by the amount retired (16GW), for a net increase of just 4GW - the slowest rate of growth on record.
If the slowdown continues global coal capacity should peak by 2022, if not sooner.Gas is cheap, solar is cheaper, wind is cheapest... it's simply no longer profitable to mine and burn coal.
-
Re: We as a culture are not ready for nuclear powe
Let's say I concede the point, that the DOE got the materials needed for solar power off by an order of magnitude you still have on a per megawatt-hour basis....
Solar power requires 3 to 10 times the materials compared to nuclear, depending on how you want to do your math. (And it would be more like 30 times if I don't concede this point.)
Solar power causes 4 to 4000 times as many fatalities. (Here's another source for that: https://www.forbes.com/sites/j... )
Solar power has the same to 10 times the CO2 output as nuclear, depending on who you ask.
(This shows solar has about 3 times CO2 output over nuclear: https://energy.utexas.edu/news...
This shows solar and nuclear at near parity: https://www.carbonbrief.org/so... )As for cost... I can't seem to find a straight answer. I'll search and keep finding sources from nuclear power advocacy places where they show nuclear is cheaper than solar. When I look for data from places that advocate for wind, solar, and hydro, they don't mention nuclear power at all. That in itself is quite telling. There's those studies from a place called Lazard that give wildly varied numbers on solar power based on the specific type and they include a warning not to compare intermittent energy, like wind and solar, to dispatchable energy, like nuclear and natural gas.
This warning from Lazard to compare solar power costs to nuclear become apparent when looking at the paper from Conley and Maloney where they compute that just the backup power in natural gas, or storage from pumped hydro, would cost double to 5 times the generation capacity from nuclear. Again, that's the cost to match the solar supply to the load, before the costs of the actual solar power generation is added. Again I'll give the link: http://www.roadmaptonowhere.co...
To defend your point on material needs you gave a pamphlet on a do-it-herself solar power kit that looks like something someone would prop up at a campsite, not a permanent install done by professionals.
So, if I concede the point on materials needed, and agree the DOE was off by as much as an order of magnitude, then it still doesn't look that great for solar. Would you like to go into the other points against solar now?
-
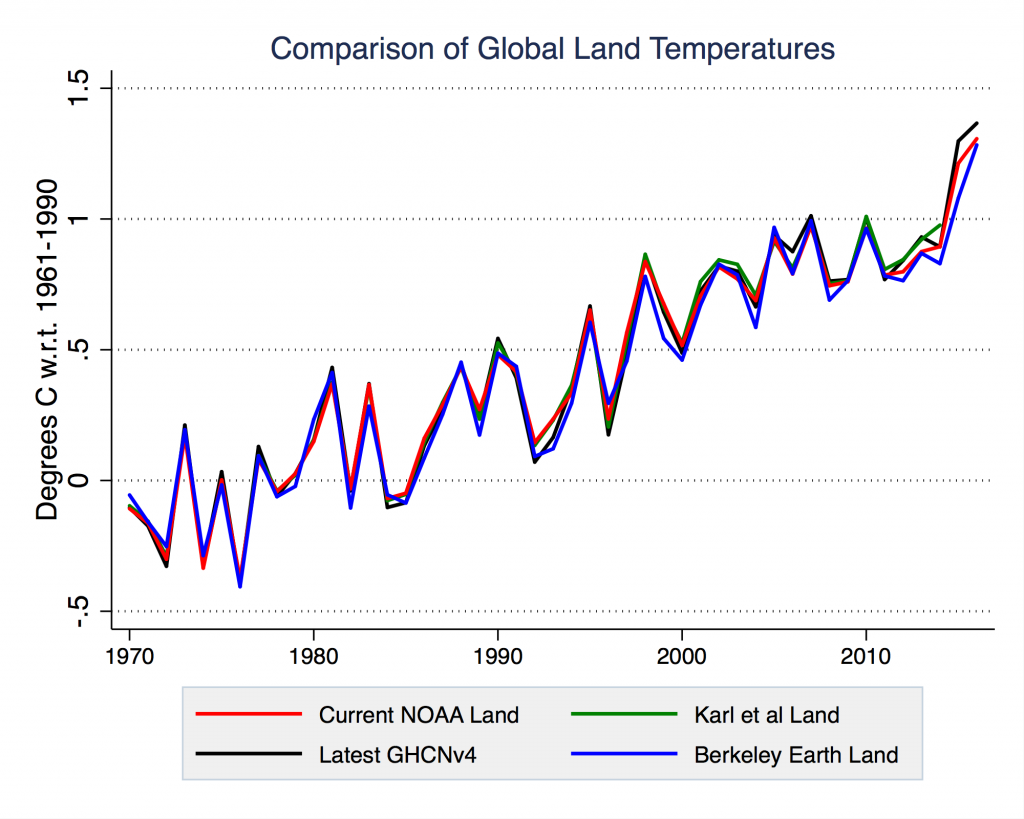
Re:Many different groups analyzing the data
How can it be taken seriously when they are constantly changing the historical temperature data to match their hypothesis?
"They" are not "changing the historical temperature data to match their hypothesis". That is a made-up alternate-fact being promulgated by the deniers.
You are referring, I assume to the Goddard Institute for Space Studies historical temperature record. The analysis of the data is exhaustively documented , including a FAQ giving an overview for popular audiences that are too bored to read the actual documentation. And the original data set, and all of previous historical analyses, are available on the web, showing that the changes in analysis technique don't alter the conclusion that the climate is warming. Here, for example, are the graphs showing the results of every different correction to the analysis, dating back to 1981.
In any case, you do know that several other groups, such at BEST, also analyze historical climate data, and come out with rates of warming that are essentially the same. So your conspiracy theory that scientists are altering their data in order to hoax the public is going to be a conspiracy of hundreds, and probably thousands, of scientists in independent groups on three different continents.
What about the climate gate emails, what do you think of those?
-
Many different groups analyzing the data
How can it be taken seriously when they are constantly changing the historical temperature data to match their hypothesis?
"They" are not "changing the historical temperature data to match their hypothesis". That is a made-up alternate-fact being promulgated by the deniers.
You are referring, I assume to the Goddard Institute for Space Studies historical temperature record. The analysis of the data is exhaustively documented , including a FAQ giving an overview for popular audiences that are too bored to read the actual documentation. And the original data set, and all of previous historical analyses, are available on the web, showing that the changes in analysis technique don't alter the conclusion that the climate is warming. Here, for example, are the graphs showing the results of every different correction to the analysis, dating back to 1981.
In any case, you do know that several other groups, such at BEST, also analyze historical climate data, and come out with rates of warming that are essentially the same. So your conspiracy theory that scientists are altering their data in order to hoax the public is going to be a conspiracy of hundreds, and probably thousands, of scientists in independent groups on three different continents.
-
Re:Problem solved! Move along, nothing to see.
Solar isn't limited to PV. What is wrong with people like you that cannot see beyond solar=PV?
Maybe it's because concentrated solar power is difficult to do, requires a large land area to build, and produces more CO2 per energy produced than nuclear, wind, or solar PV. Look at the chart about halfway down this page:
https://www.carbonbrief.org/so...You do not need to feed the grid, you do not need to store power in batteries. Stop associating solar with PV! Pumping water into reservoirs during the day and using gravity to feed turbines is proven tech and has been in operation since the late 1800s. Again, why is it not being implemented?
Here's my guess, this is not popular because to implement it takes a place with a lot of sun, a lot of water, and a river suitable for a dam. Places with a lot of sun tend to not have a lot of water. Places with water and a river worth a dam may not have a lot of sun. Even if they have all three this water is likely to contain a lot of salt, which eats away at turbines. To resolve the issue of salt water on turbines means desalinating the water, but that water is far too valuable as water for drinking to run through a turbine and dump in the sea.
PV is a dead-end. Always has been, always will be.
I won't go that far. PV is great for communication satellites and pocket calculators.
-
Re: Could have been structured differently...
That $5.3 trillion number is a fraud, cooked up to make it look bad. Actual subsidies are around $373 billion, and renewables are about double fossil fuels.
-
Re: It's morally binding
Hey wanker, your nation is still out of control and the ones to blame for the CO2, not just the Yanks. China lifted 1 child 3 years ago and now you are back to breeding like bloody rabbits when you are not raping each other. You make India look wonderful for women. Total muppet.
And yes, even as your nation continues to pollute heavily, you are adding (not simply replacing) even more coal plants all over the globe, including your own nation. Tossers like you continue to lie and try to defend what your nation is doing when you are the worst. If the yanks start building new coal plants, then you will have made things much worse.
piss off and go back to Xi's knob. -
Re:We withdrew from the Paris agreement
How very U.S. centric of this article.
According to Carbon Brief, which is tracking all the Paris pledges, the U.S., made a pledge, but unlike most countries, never legally ratified their pledge. Also, unlike the U.S., the vast majority of those countries haven't decreased their carbon output as much as the U.S. in the years since.
So the Paris Accords are useless for anything but virtue signaling and political posturing. Of course, that was predicted at the time they were negotiated, so not a surprise.
-
Re:Do you believe in global warming from CO2 or no
I would be fine with 100% of the nuclear power costs being subsidized... but you realize, that means they'd be owned by the government. That means no private company making a penny off them, and that translates to cheaper electricity.
But, it's not a single choice.... nuclear OR carbon dioxide. Wind, solar, geothermal, wave.... all of those things provide the same "no CO2" benefit, and none of the "radioactive contamination for 10,000 years" downside. Additionally, solar can be applied small scale, like solar panels on rooftops, which is an immense benefit as you don't have to invest billions just to get a single site up and running.
https://www.carbonbrief.org/so... read the Carbon Debt section to see why your "nuclear has a smaller footprint than any other" is wrong. The first generations of solar panels, for example, are made using energy from conventional power generation (whether it's coal or natural gas in that area), BUT, as those solar panels get put into use, the origin source for the energy to make the next batch changes... it no longer comes exclusively from coal or natural gas. And that process accelerates.
Showing concern that the first of something is going to be more expensive than the 100th, or 1000th (whether in actual dollars, or in this case a carbon debt) really is only an argument for never, ever, doing a damn thing to innovate anything. -
Re:Why should the US Gov't care?
In numbers:
https://www.carbonbrief.org/an... -
Re:meh. ppl really do not care
Until we actually get ALL nations going on this esp CHina, it will not matter.
As can be seen, America and the west continue downwards, but at a glacial pace. The real issue is that China CHina, India, and the rest of the 3rd world nations, continues to grow their emissions. In 2017, they grew and that was based on numbers that CHinese gov reports. They refuse to allow anybody to directly measure. OTOH, OCO2 continues to show that EVERY year, China's emissions continue to rise, and not go down like that this showed. When OCO3 arrives next year, real values will be used, and not just relative values.
Regardless, unless we ALL stop with doing new coal plants, this can not be dropped. -
Re:Oh, say can you see?
2012 did not see EV outselling ICE at any point, even today. "Clean energy" is still a mere fraction of total power output, especially for long term 365/24/7 reliability.
No expect predicted that EVs would outsells ICE cars in 2012, but the fraction of cars which are electric has been steadily climbing. In 2017, more electric cars were sold than the previous year which sold more than the year before that, and that occurred even as overall car sales *went down* https://arstechnica.com/cars/2018/01/2017-was-the-best-year-ever-for-electric-vehicle-sales-in-the-us/. It is likely going to be a long time until electric cars outsell internal combustion cars, but that's a distinct issue.
As for the idea that clean energy is only a fraction of total electric power, that's true, but the size of that fraction which is wind and solar or geotherma has been growing. It is true that the overall percentage did initially trend downwards as the US reduced the amount of hydroelectric power (in part because of its other environmental issues) but the percentage has been going up in the last few years even given that https://en.wikipedia.org/wiki/Renewable_energy_in_the_United_States#/media/File:USRenewableElectricity.jpg. Moreover, total US CO2 production has trended down the last few years https://www.epa.gov/ghgemissions/us-greenhouse-gas-inventory-report-1990-2014. And while CO2 emission worldwide did likely go up slightly in 2017, that was after three years of it being flat https://www.carbonbrief.org/analysis-global-co2-emissions-set-to-rise-2-percent-in-2017-following-three-year-plateau.
All of that said, it is true that we're not moving fast enough. So what can you as an individual due to help out? Well, there are the basic things you can do personally, such as use more public transit, eat less meat, and keep your house well insulated. Moreover, all those are things which will pay you back, since you will save money from them. However, small personal changes aren't enough. So what else can you do?
If one wants to help directly with helping reducing CO2 production then donating to solar and wind charities is the best bet. For solar, the best two seem to be Everybody Solar https://www.everybodysolar.org/ (which gets solar panels for non-profits like museums and homeless shelters), and the Solar Electric Light Fund https://self.org/ which gets solar panels for people in developing countries. Right now, the best specific wind charity in the US, the best one seems to be the New England Wind Fund https://www.massenergy.org/the-wind-fund. Finally, if one wants to directly reduce CO2 in the short-term, then the best bet is simply directly donating to Cool Earth https://www.coolearth.org/. Every little bit helps.
-
Re:Great news!
Can you give citations for your claims? I'll provide a couple.
Nuclear has lower carbon footprint than solar:
https://www.carbonbrief.org/so...Nuclear power is safer and cheaper than solar:
https://www.youtube.com/watch?... -
Re:Someone said once...
Both of those papers deal with overestimation for a particular 15 year period (1998 - 2013) and the second is based on tropospheric satellite measurements rather than ground temperature measurement like the first study. There have are disputing papers that say the divergence is within the bounds of natural variability, and this nature article seems to sum up the divergence issue: "There is no evidence for a change in the long-term warming trend, he says, and there are always a host of reasons why a short-term trend might diverge — and why the climate models might not capture that divergence."
In any case, there have been multiple developments that indicate that the temperature record was biased low over the period both your papers consider in several areas: ocean warming, temperature coverage at the poles, and systematic errors in satellite measurements. Each of which has been found to have a small, but significant, effect on the temperature record. It doesn't look like Fyfe and company have released a new paper that accounts for those issues, yet.
-
Re:LOL
Global warming is real, but a 30 foot sea level rise by 2100 is not. The article's source was this article, but note right off the bat: "It would be a steady climb, with sea levels taking centuries to rise this far." Not by 2100. Sea level rises in response to climate forcing take time, they don't happen the instant that the atmosphere gets hotter. And it's a curve that accelerates with time (most of the rise is backloaded). It can take much of a millennium for sea levels to adjust to new atmospheric conditions.
For 2100, you're only looking at somewhere around 2m, give or take (up from previous ~1m estimates, which have been shown to underestimate accelerating rates of land ice loss). That said, the important thing is not the "2m higher on a typical day" aspect, but the "2m higher on top of storm surges" aspect.
-
Re:Is it just me but...
You do realize that you're linking to someone's blog, not an established news source? And that the author literally cites scientists that "poisoning from scavenging carcasses tainted by lead ammunition is likely responsible for many of the [bird] deaths", before wondering why "nobody" is concerned about windmills.
Well, here's the reason: As has been established repeatedly, the number of birds killed by windmills (on the order of half a million a year in the entire US) is completely dwarfed by, say, the number of birds killed by windows (on the order of one billion ), not to mention cars and cats.
That's not to say that people are not concerned with birds killed by wind mills, too. (And bats, porpoises and other animals.) The problem is fortunately entirely manageable by choosing appropriate locations for wind farms and other precautions. In particular, the construction (like all big construction) is a much bigger environmental issue than the actual operation of the windmills. E.g. here's Siemens Wind Power describing a solution to minimize noise pollution for endangered porpoise populations and other marine life during construction of off-shore wind farms.
(Then there's that other growing threat to birds: Climate change. Which is why the Massachusetts Audubon Society supported the Cape Wind project.)
-
The paper that started modern climate modelling
If you read any of the literature, you'd know that this is the reference-- the Manabe and Wetherald paper was the first to fully model the co-effect of carbon dioxide and humidity in a convective atmosphere, and is the one pretty much everybody references.
Here https://www.carbonbrief.org/pr... for example, or here https://www.skepticalscience.c...
Manabe was the grandfather of global circulation models-- pretty much all the models that exist today can be traced back to his work. This wasn't a "random" paper-- this was the paper.
-
Significant figures [Re:Within error margin]
20th century patterns aren't "current trends". Current trends suggest constant or declining carbon emissions.
The data shows otherwise: http://www.energytrendsinsider.com/wp-content/uploads/2012/07/Global-CO2.png
Your graph cuts off in 2010.
I notice you don't bother to cite any data supporting your claim of a trend of "constant or declining carbon emissions". Unless you have some data showing such a trend-- and a trend long enough to be meaningful-- I stand by my statement.
If you're quibbiling, Manabe and Wetherald's calculated climate sensitivity was 2.4, not 2.0. [...] (with your rounding of "2.4" down to "2" corrected)
I didn't round, that's what the paper says: "According to our estimate, a doubling of the CO2 content in the atmosphere has the effect of raising the temperature of the atmosphere (whose relative humidity is fixed) by about 2C". You really need to read the paper, instead of random blog posts.
I'd actually checked the number out of a textbook that I happen to have near my desk (Liou, An Introduction to Atmospheric Radiation, 1980, if it matters-- my usual go-to book on atmospheric light scattering) instead of digging up the original paper. But turns out it's not hard to dig up the paper, it is on the web several places, so it's easy enough to check: http://ruby.fgcu.edu/courses/twimberley/EnviroPhilo/ThermalEqu.pdf
And, how about that?-- you're almost right. "About 2C" is indeed what is says... in the abstract.
In the body of the paper, though, they give the calculated result to more than one figure. Table 4 and table 5 shows their calculated results. The increase from 300 to 600 gives an effect of 2.36C (for fixed relative humidity and "average cloudiness;" slightly higher for clear skies).
So, I withdraw my statement that you rounded their result down. In fact, it wasn't you: they did the rounding. Nevertheless: the number was 2.36 (but the parts after the decimal point are probably not significant.)
For what it's worth, their 1975 paper, calculating with a three-dimensional model instead of the 1967 2D model (which means that they have both oceans and continents, instead of an average of ocean and continent), came up with 2.39 degrees per doubling-- nearly the same.
I don't see much real information in the rest of your post, you're arguing your opinion and policy, and not significantly disputing facts. You're saying you don't like the models because you don't understand the feedbacks, but you're more or less ok with the results to the first significant figure, although to a second significant figure you prefer a number slightly on the lower side but still within the error bars, but you think that existing societal trends will reduce CO2 emissions anyway so the predicted warming will be lower than the highest value of the IPCC scenarios (which is what the IPCC also seems to thing: that is the high case.)
OK. I'm not sure that there's enough in that to bother arguing with.
I will, however, quibble with two points:
There is nothing "paradoxical" about it; irrational climate change deniers are largely a figment of your imagination.
No, irrational climate change deniers are certainly out there, and say all sorts of bizarre things. However, you have clearly shown that you are not an "irrational climate change denier," since you're arguing with numbers based on the real science. That is neither irrational, nor even being a "climate change denier" of any kind. There doesn't seem to be a quick category nam
-
Re:Within error margin [Re:Scenarios]
The data shows otherwise: http://www.energytrendsinsider...
Your graph cuts off in 2010. Furthermore, you need to look separately at developing and developed nations; most of the growth for the last 30-40 years has been due to developing nations; their emissions will flatten out as they become developed.
If you're quibbiling, Manabe and Wetherald's calculated climate sensitivity was 2.4, not 2.0. [...] (with your rounding of "2.4" down to "2" corrected)
I didn't round, that's what the paper says: "According to our estimate, a doubling of the CO2 content in the atmosphere has the effect of raising the temperature of the atmosphere (whose relative humidity is fixed) by about 2C". You really need to read the paper, instead of random blog posts.
My objection stands.
Well, you are objecting to an argument I didn't make. The argument I have been making is that their worst case scenario, combined with "basic physics" only predicts a little over 2C warming between now and 2100. I'm pointing out that their worst case scenario is "absurd" not in order to accuse them of dishonesty, but in order to get across that even their worst case scenario is actually far above any realistic estimate. So, when you combine a realistic estimate of future carbon emissions with basic physics, you end up with even more modest increases in global average temperatures, and even less noticeable increases in most populated regions.
You've been asserting that some of the science is weak,
Yes, in the sense of "weak" = "not derived from basic physics". Are you serious wanting to claim that every aspect of these models, the albedo predictions, the ecological response, the emissions projections, the economic models are all derived from "basic physics"?
you quote a climate sensitivity within the error bars of the current best estimate.
Error bars don't work that way: you can't say "2C is within the error bars of the 3C estimate, therefore we can make predictions with the 3C estimate". The best estimate according to basic physics and the best estimate according to climate models differ substantially.
And your whole line of reasoning is symptomatic of climate change activists and scientists: they string together little exaggerations, small assumptions here and there, and the occasional half truth, and when you add them all up, it looks like you end up with a substantial threat while still pretending that every single step is fully justified by basic science.
Nevertheless, paradoxically, you seem to actually agree with the conclusions of the report
There is nothing "paradoxical" about it; irrational climate change deniers are largely a figment of your imagination. The basic physics is clear: 2C per doubling. It's just that if you put the basic physics together with a reasonable economic projection of future carbon emissions, there simply is no need for action, since temperatures will remain within the range that even the IPCC considers acceptable. If you go beyond basic physics and end up with 3C per doubling and combine that with reasonable economic projections of future carbon emissions, you still end up with something only a little more serious.
The only way you can concoct an imperative for action out of that is by making unreasonable economic assumptions and the proposing equally unreasonable government interventions, interventions that will harm billions of people for no tangible benefit.
-
Re: Testable predictions
I wish "you guys" would stop presenting data from known corrupt orgs as real.
Also, I note you completely ignored my comment about data manipulation.
Hide the decline!
If you go get the raw data and plot it out you will still get something pretty close what the "manipulated data" shows. In fact since about 1940 it's difficult to tell the difference between the two.
-
As early as
That phrase "as early as"--what does it mean, exactly? If you call this a "prediction"-- what did it predict, and how can you tell whether it is accurate?
Here's a good discussion: https://www.carbonbrief.org/gu...
And here's a nice one with a pretty graphic visualization: http://sciencenordic.com/when-...
-
Re: air pollution != climate change
we start seeing meteoric rises in global temperatures, the kind which match exactly the predictive models that simulate 100 years of pumping billions of tons of pollutants into the atmosphere
Absolutely correct for sufficiently loose definitions of "exactly."
Back in the real world, the models don't even accurately reflect the actual historic temperature record we have . Even the apologists don't seem to deny this. See, e.g., the error bars in the first chart after the heading "Comparing models and observations" here, which shows the models don't even purport to track actual historic performance by much better than 1 degree C.
Seriously, when you can't even build a model that can correctly spit back out the past data already available to the modeler, it seems a bit much to crow about its precision.
I'll leave the parallel analysis of "every single climatologist on the planet" as an exercise for the reader.
-
Cost comparison
Usually these renewable reports are grossly exaggerated to make it seem like renewable is more capable than it really is. But this one is actually fairly accurate.
10 MW * 0.097 capacity factor = 970 kW
970 kW / 2500 homes = 388 Watts per home
Average UK home annual consumption is 3940 kWh
3940 kWh / 1 year = 450 Watts average consumption.
So their "homes powered" metric is fairly close to accurate (2150 homes would be exact). We'll go with the exact 450 Watts per home figure.
To put this in perspective, the proposed Hinkley C nuclear plant would have a 3.2 GW capacity. Using the 90% capacity factor for newer nuclear reactors, this would give an actual generation of 2.88 GW, or enough to power 6.4 million homes.
At a construction cost of 24.5 billion GBP (the UK has some of the most expensive nuclear in the world), this works out to 3828 GBP per home powered.
If you run the same calculation using the 70% capacity factor for the UK's older nuclear plants over the last 5 years, it works out to 2.24 GW. Enough to power 5 million homes at 4900 GBP per home powered.
Unfortunately none of the news reports on this new solar farm that I was able to find mention its cost. This site estimates a utility-scale solar installation in the UK costs about 1.1 GBP per Watt. That works out to 11 million GBP / 2150 homes = 5116 GBP per home powered. But it doesn't include the cost of the 6 MW battery. -
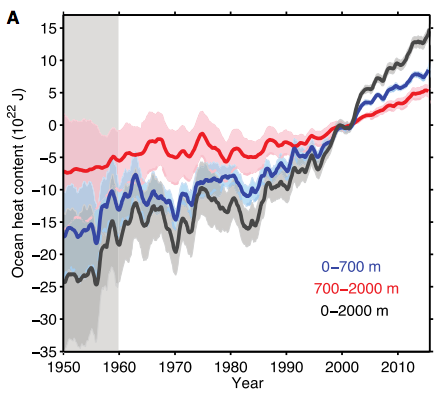
Re:bit of maths
That represents 4761904760 Hiroshima bombs of energy added to the system, or about 3.2 per second. About 4/5ths of that energy accumulated in the top 700 meters. The rate of warming is accelerating, meaning that the top of atmosphere energy imbalance is increasing. The impacts of the warming are already being observed, even at this early stage.
-
Not fake news, but agenda news
Turns out Germany uses a shit-ton of carbon based energy sources:
https://www.carbonbrief.org/ho...
Call me when renewables make a dent in their existing carbon based energy sources.
Before anyone accuses me of working for the carbon-based energy folks - I have a Model 3 on order - but I have no illusions as to what will be generating the electricity that I will use to charge it. In my area it's mostly Nuclear and Coal.
I expect more critical thought from Slashdot readers.
-
Re:Retribution
The baseline is a constant offset, so nothing was "adjusted to fit" anything, just translated down. Look, animated gif. If you did it the other way around the lower graph would just move up. Here's more detail on the baselines, and more graphs.
-
Re: Wow!
China has already hit its peak coal consumption and it's now in decline.
https://www.theguardian.com/en...
https://www.carbonbrief.org/an...
https://www.eia.gov/conference... -
Re:more disguised opinion
If the facts are so important, why don't you present facts?
We do, we present facts on a regular basis. That's our job.
Problem is, the regular person doesn't spend much time reading academic journals. They'd rather get their news from Facebook or Twitter. So we've created these sensationalist measures to call attention and stir debate on the real facts that otherwise might go unnoticed by the general population.
-
Re: tops down, bottoms up!
I don't think that makes sense. It hasn't been up long enough, and had it been, it might have forced a downward revision. http://www.carbonbrief.org/stu...
-
Re:Thanks! XOXO, Putin
The UK doesn't buy gas from Russia:
http://www.ukoog.org.uk/knowle...
Our coal however does come from Russia (and Colombia and the US) though, not Ukraine:
http://www.carbonbrief.org/gas...
So here we've clearly got a policy that actually decreases dependency on Russia, not the contrary as you're claiming.
If the UK ends up fracking then between that and a ramping back up of North Sea gas production (or even Falklands gas extraction) the UK could easily become energy independent for quite some time.
Which isn't to say I in any way support this, I'd much rather just see more renewable, or even nuclear usage. This is just the easiest and lowest risk way of making sure that if the shit hit the fan that we could look after ourselves. Personally I'd rather just see us take more risks on the renewable route though. That way we can become energy independent without all the downsides of fracking and such.
-
It simply ISI have no idea what the definition of "runaway" has to do with anything, but changing conditions in the ocean really are happening.
Just like decreasing ice-caps, sea-level rises, and increasingly chaotic weather. And threatening changes in major ocean currents
And they could be mand-made to
-
Re:Actually there is a 34% CHANCE...
You are correct that the temperature observations in the four datasets are not all statistically independent. There are a finite number of weather observation stations in the world, so of course there will be overlap in the raw data used to generate the datasets. That's why I described them as "methodologically independent datasets, all derived from raw temperature data from land and ocean surface temperature observations." The State of the Climate report uses similar language. In other words, they might share input data, but the methods used to generate the final datasets (e.g., how to perform data quality control, how to interpolate missing data, etc.) are independent. That was all I meant. So yes, you are correct that the data themselves are not all independent. The semantics are messy and annoying, so I am sorry if what I meant wasn't clear.
ALL the datasets they use in this study are directly controlled by the NOAA. They are each adjusted and calibrated... by the NOAA...
But that's objectively not true. Look at the methods used to generate the datasets. Yes, all four datasets use GHCN, but some of them use other data sources in addition to GHCN, and they don't all use ERSST. They take very different approaches to deciding which stations to include, how to correct for missing data, and so on. So yes, there is overlap in source data, which is probably inevitable if you are trying to compile a global dataset, but the final products certainly do not "come from the NOAA" or even rely exclusively on NOAA data. (Caveat: This is based on my non-expert readings of dataset summaries and descriptions.)
Look, I definitely see your point about the datasets not being statistically independent. That is absolutely correct. But claiming that they are all "directly controlled by the NOAA" and "adjusted and calibrated by the NOAA" comes across as disingenuous. It's probably best just to say that they're not statistically independent and leave it at that.
my bias corrects from 35 to 30. The figures based on the math alone were showing something around 35 to 38 percent. But given that we've had corrections to the models and the figures going on for years and they always correct them DOWN... I personally decide to read the numbers as being slightly lower than cited if only in anticipation of the next correction.
Whatever works for you, I guess, but applying an arbitrary 5% downward adjustment because your gut tells you the numbers might be biased is not very defensible. Unless you have actual evidence that the station readings are biased upwards, or that the datasets are fudging the anomalies upwards, you really have no idea whether a correction is needed, let alone how large of a correction to apply. You could be right -- I don't know, and neither do you. Arbitrarily changing the study results because of a hunch is sketchy, at best. Consider the opposite: Some have argued that the JMA dataset underestimates the true extent of climate warming, but I doubt you'd accept an arbitrary 5% upward correction as a result, and neither would I.
Regardless, I suspect we can both agree that, in the end, the precise probability that 2014 was actually the warmest year isn't all that important. The general trend probably matters more, and no one is disputing that 2014 was one of the hottest five or ten years on record.
Anyway, thanks for the interesting (and civil) discussion.
-
Re:Does This Make Sense?
Battery evolution has been moving along at a fairly steady pace averaging around a 5-8% improvement in capacity per year. In addition, the longevity has been steadily increasing and charge times have been steadily decreasing and cost have been dropping fairly rapidly, much faster than predicted.
If you compare today's batteries used in cars compared to those a decade ago there is really no comparison. Today's batteries have much higher capacities, much longer life and at a much lower cost.
http://www.carbonbrief.org/blo...
Here's a chart from 2012. Tesla is selling their grid storage battery packs at around $250/KWh and with the gigafactory the prices will be further reduced. This is the price point where BEVs start to become price competitive with gasoline cars.
http://www.mckinsey.com/insigh...
Battery prices are already at or below where they were predicted to be in 2020 just a few years ago.
http://theenergycollective.com...
On average, battery energy doubles every ten years.
http://kk.org/thetechnium/2009...
http://electronicdesign.com/po... -
Re:nothing to do with the end of the last ice age?
You have an interesting hypothesis. I look forward to your evidence supporting it. The other side has already weighed in on it, though.
-
Re:Huh?
Also this that I just saw:
http://www.carbonbrief.org/blo...
"There's little consensus. Some analysts argue that the falling oil price could end the world's slow march towards zero carbon energy. Others say renewables are established enough to see out the storm.
There are good reasons for such uncertainty. The renewable energy industry's fate rests on a number of factors that are very hard to predict."
Generally we know that we don't really know.
Rgds
Damon
-
Re:They WILL FIght Back
What about bird kills, though.
Bird kills do happen. The relevant questions to ask would be: (a) how much do wind-farm bird kills effect the bird population, relative to other sources of bird mortality, and (b) how many birds would die in the alternative scenario, where the wind farm is not built?
The answer to (a) is: not very much.
The answer to (b) would of course depend a whole lot on how society chose to produce its energy instead of by from wind. If society continued to burn fossil fuels instead, the likelihood is that climate change would wipe out a lot more birds than windmills ever could. OTOH, if society chose to build nuclear plants or solar plants instead, it's possible that those options would kill fewer birds. As with most hypotheticals, there isn't an easy answer; but pretty much every energy solution (other than energy conservation, which is very much underrated IMO) comes with some environmental cost, and of course bird conservation is only one of many considerations that have to be taken into account.
-
Re:please no
There are NO American Tanks in Baghdad!
-
Re:But they will not
Take the study BS a step further.Here is the hockey stick. You will note that from the time of christ, where it was around low 600s, by 1800, it was low 700's. All of that was the great nations that had large populations and GDP: Basically, China and Europe. By 1900, it was 800. And yet, that was when America was JUST taking off. China, and Europe still remained night and day above America in consumption. America's hey day really was from around 1950-2007. Since 2007, America has dropped our emissions. We are at 5 nillion tonnes in 2012.
Here is a chart of 2008 CO2 emissions. You will see that China is at a minimum 23% of the world's emission, while US is at 19%.
In 2012, you will see that the world emitted slightly more than 30 billion tonnes, with China emitting ~10B tonnes, America at ~5B tonnes, and western europe at ~4B tonnes. That means that China is at about 1/3 of the emissions in 2012, with America at about 1/6, and western Europe at about 1/8 (note that does NOT include eastern europe, which is where they offshored the dirty stuff). And this is un-normalized emissions.
And now, America has CO2/$GDP that is about the same as Europe's. OTOH, China's is at the bottom of the list. China is rapidly approaching 1/2 of the world's emissions (expected in 2-3 years). OTOH, America's will be below Europe since Europe is moving back to Coal, while America is destroying our coal plants. -
Re:We've gone beyond bad science
If anything, the IPCC errs on the conservative side.
Like hell they [sic] are.
https://www.skepticalscience.c... ".. the evidence suggests that changes in climate are occurring faster, and with more intensity, than the IPCC have predicted. It is not credible to suggest the reports were biased in favour of the theory of anthropogenic global warming when the evidence demonstrates the IPCC were, in fact, so cautious."
http://www.irinnews.org/report...
"The international scientific community’s new assessment of the estimated sea level rise caused by global warming is a significant development, but experts say the projections for higher sea levels in the Intergovernmental Panel on Climate (IPCC) assessment report (AR5) are still on the low side. The projections are of immediate concern to low-lying countries and small island states."
http://www.realclimate.org/ind...
"This is where the “conservative” estimates of IPCC, seen by some as a virtue, have lulled policy makers into a false sense of security, with the price having to be paid later by those living in vulnerable coastal areas."
http://www.scientificamerican....
http://www.carbonbrief.org/blo...
What is done in these highly politicized reports, is take the 5% extreme case, say in California and report that. Then take the 5% most extreme case in NY and report that.. So on and so forth. Now even if these "confidence" things could be interpreted as probability of the event occurring, which they can't. They present all of these 5% things all over the world as if that is what could happen, while even with this poor interpretation of data, its a million to one that even a dozen of these predictions to come true. Its total misrepresentation of the model/data at best and scientifically dishonest.
Yes, yes. And at the bottom of your garden there are fairies as well! It must be true, because you said it was. No need to provide evidence or anything boring like that.
-
Re:Ha ha ha ha ha
BTW, Here is a decent article about the situation.
As it reports, America is dropping our emissions a great deal. We have been for 6 years, which is why the stats like to use 2005, rather than the more accurate 2011 or 2012.
In addition, it points out that 60% of the emissions come from '3rd world' nations, which for all intents and purposes, means the BRIC nations. The developed world emits less than 40%, with just China emitting more than EUROPE AND AMERICA COMBINED. -
Re:Summary
A solar cell takes far more energy (likely coal or oil) to produce than the panel will ever, EVER, get back in its usable life.
Wrong, a solar cell will produce 6x as much energy over it's life as it took to produce. That factor is continuing to increase. It's not as good as most other electric power sources, but it edges out nuclear's 5x. http://www.carbonbrief.org/blog/2013/03/energy-return-on-investment-which-fuels-win
Zow, EROI of 5 for nuclear? That's amazingly low. Most quotes I see are for around 40-60.
The referenced paper: Life cycle energy and greenhouse gas emissions of nuclear energy: A review seems to be somewhat out of step with other figures I've seen.