 Slashdot Mirror
Domain: iea.org
Stories and comments across the archive that link to iea.org.
Comments · 110
-
The articles are shit
Having read this and the the source article, it is obvious the articles are trying to hide the fact that China and India are the major contributors to the increase and that U.S. coal is no where near the player it is portrayed to be. The author of the article is writing propaganda to push an agenda instead of being a journalist and presenting the true facts.
-
FUD stats...
The lightweight article referred to above has links to a more thorough article that gets to the important details (https://www.iea.org/newsroom/news/2019/march/global-energy-demand-rose-by-23-in-2018-its-fastest-pace-in-the-last-decade.html)
The issue here is that the demand for electricity increased by a large percentage in the US, China and India. Obviously something has to ramp up to meet those demands. In the US that was primarily natural gas, the usage of which increased by 10% in 2018. China is using coal to meet their increased power demands.
So why is power consumption increasing? The article above said a significant portion was due to colder than normal winters and hotter than normal summers, thus requiring more power for heating and cooling. In the US petrochemical demand has increased due to trucking and industrial consumption. The economy is strong, growth is occurring, and that is fueled by energy.
So the FUD here is that "emissions continue to rise" is not due to a shift back to coal, but the use of fossil fuels to meet a quick increase in energy demands. Solar, nuclear, wind, etc, cannot ramp up nearly as fast as gas and coal, because those plants already have spare capacity to meet peak demands. If the higher rate consumption continues then renewable sources will continue to grow to reach at least their previous percentage share of power generation.
-
Negativity bias much? How about the good news?
There's an interesting quirk in human psychology that makes negative facts and news seem more salient than positive ones. For media that thrives on reader attention (and that's both new and old media), this naturally leads to more emphasis on the negative.
I think this is a bias worth noting and pushing back on. The world is pretty far from perfect, but there's also huge helpings of good news all around us.
- Continuing the trend, nearly 70M people in dire poverty gain access to electricity
- Extreme global poverty continues its decline, although it's getting harder to make progress on that front
- The US death rate from cancer continues its steady yearly drop. Cumulatively, this has prevented hundreds of thousands of deaths
- The pack of criminals who made a wholesale business of taking sex slaves in war lost their last city
- The world continues its steady march towards universal literacy. You can't embed pictures in
- The Long Peace continues for another year, meaning millions of lives impacted
- Cigarette smoking, a leading cause of totally preventable death, fell to its lowest rate in the US
- Automobile deaths per vehicle mile continued to drop
Most of these (Daesh not withstanding, but threw them in just because they were really vile) follow the same pattern: slow but steady progress. It's hardly clickbait -- in fact these are not even specific events you can point to, they are trends seen on the scale of decades. And on the scale of decades, the world is consistently becoming a less-bad place.
-
Re:Was Article Summary run through google translat
Mostly coal.
Nope. In 2015 Japan was:
39% gas 34% coal 9% oil 8.4% hydro ~4.3% other renewables 0.9% nuclear
Data from the IEA: https://www.iea.org/statistics...
So its mostly coal and gas. Such a huge difference. And the question was what replaced nuclear, not what does Japan use. So if that coal was say 20% before 2011, then it was mostly coal that was added. People like you are the reason we will never have carbon free power and use so much coal. And you wonder why greenies don't win elections. Power production is an engineering task. Leave it to the engineers to solve. When politics enters into it, you can be assured that we won't find a good solution to the problem. The coal producers thank you for being such a useful idiot.
-
Re:Was Article Summary run through google translat
Mostly coal.
Nope. In 2015 Japan was:
39% gas
34% coal
9% oil
8.4% hydro
~4.3% other renewables
0.9% nuclearData from the IEA: https://www.iea.org/statistics...
-
Yet more lies from WindBourne.
Are you going to lie again and claim your account was hacked and that's the reason for all your lies.?
You were shown the facts numerous times. American AC is worse, than China's. Its just a fact WindBourne.
Even though you have better AC available, you get the cheapest and crappiest.
It's clear in the pretty picture Europe, Japan, Korea and China are all better than America.
Why do you still lie about this and all things WindBourne?You could buy the best. You have the best available. But Americans clearly care the least about the environment and get the worst that they can. China has much less money and worse AC available. But they still by better AC than Americans.
This is all old news to you WindBourne. You tried to lie about it last time as well, but now you are too stupid to remember. Or is lying just so natural to you it's like a reflex?
China obviously doesn't import all those electric cars from the US. You are going to have to show how America manufactures the most EVs. Or just more lies from you? Only a handful of states even have EV's as more than 1% of car sales. That bubble you live in will pop one day...
-
Still you lie about this WindBourne?
You were shown the facts numerous times. American AC is worse, than China's.
Its just a fact WindBourne.
Even though you have better AC available, you get the cheapest and crappiest.
It's clear in the pretty picture Europe, Japan, Korea and China are all better than America.
Why do you still lie about this and all things WindBourne? -
Re:Switching to EVs does very little good if
Switching to EVs does very little good if 95% of your electricity generation is via fossil fuels. All you're doing is shifting the CO2 emissions from the tailpipe to the smokestack.
This move, in the 2018-2030 time frame is not intended to eliminate CO2 emissions from motor vehicles in Israel (though in the longer run it is absolutely the path to get there).
You need to look at Israel's plans for providing electricity in 2030 also. At that point their power will be 80% natural gas, 20% renewables (they are eliminating their use of coal entirely). Natural gas is a fossil fuel, but in a combined cycle plant it drastically reduces CO2 emissions compared to ICE vehicles (see below) to only 38% of the present emissions, so yes it moves the ball way forward.
The overall energy efficiency of EVs powered by fossil fuels is barely better than ICE vehicles
Now you are just making yourself look like a fool. The efficiency of natural gas combined cycle plants is expected to hit 65% in the next decade (i.e. before 2030), whereas ICE vehicles are limited to about 21% efficiency. Throw in a generous 5% transmission loss (small country, short transmission distances), and a 90% charge to wheel efficiency for 2030 era EVs, and you still have an overall efficiency of 55%. "Barely better", sheesh.
-
Re:Oh boy, so much fail in one post.
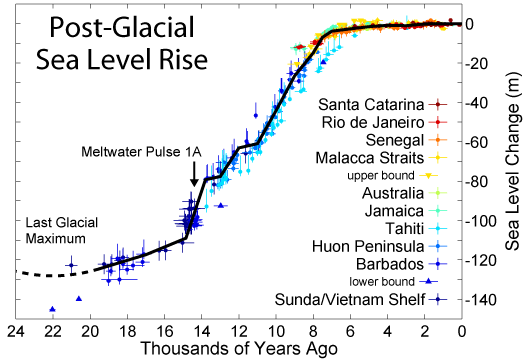
So you don't dispute sea rise has been negative for about six years?
That's a start I guess.
The rest of your argument pretty much doesn't matter after that now does it? You haven't found fault with either the data or the logic here, and merely sought clarification of one part you don't understand.
So in case you don't resistant quite what what you're looking at, here goes.
Because nominal sea was was unchanged for about 8000 years, never went up, that was an error, and six years ago flipped when ice began growing again.
Perhaps I explained that badly in my post. Please allow me to try again.
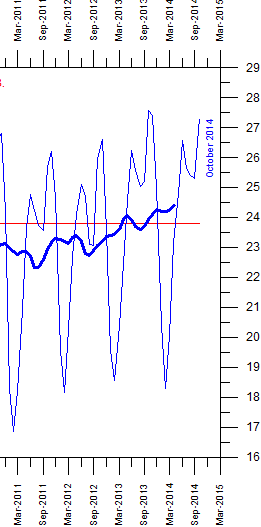
If you look at the longer term map you can see the sea rise for the past 8000 years was pretty constant. Then, six years ago it began falling. I did not try to make a graph like that with only six years but if you were t try the tool at nasa to get just the last 10 years it gives you this, at least it did with my browser, why don't you try it?
Now, there were spurious reports of "sea rise" in Miami but not, only 50 miles away, in the Florida Keys it was not rising. This was found out to be because Miami was sinking, as was Beijing, by about four inches a year because the silly fucks pumped all the groundwater out. You know how nature abhors a vacuum.
Here's the long history of sea rise:
http://rs79.vrx.palo-alto.ca.u...
Look around 8000 years back. See that? That's the 33,3 century nominal sea rise.That stopped a few years ago.
Now, if you look at the same time period in the NSIDC graph is ice, you'll see there's a corresponding uptick in sea ice:
http://rs79.vrx.palo-alto.ca.u...Ok? So uptick in ice, seas fall. Got that now?
Nore that carbon dioxide also flarlines 6 years ago.Here's the stuff on the error in sea rise measurement in Miami:
Here's a picture of it:
http://geologylearn.blogspot.c...
Here's thr article in Nature about Florida.
http://www.nature.com/news/sou...
Here's the article about Beijing.
http://www.theweek.co.uk/73907...Here's the Co2 flatline stuff:
2015 CO2 has flatlined.
13 March 2015 Data from the International Energy Agency (IEA) indicate that global emissions of carbon dioxide from the energy sector stalled in 2014, marking the first time in 40 years in which there was a halt or reduction in emissions of the greenhouse gas that was not tied to an economic downturn.
http://www.iea.org/newsroomand...2016 CO2 flatlined for a second year in a row.
"The IEA reports that for the second year in a row, the world economy has grown while energy-related CO2 emissionsremained flat."
http://thinkprogress.org/clima...2017 CO2 emissions remain flat for a third year.
IEA finds CO2 emissions flat for third straight year even as global economy grew in 2016 17 March 2017.
https://www.iea.org/newsroom/n...MIT Technology Review also reported the fact CO2 stopped rising as well.
https://www.iea.org/newsroom/n...It doesn't matter what you "believe". The facts are, seas a falling, ice is growing and coe
-
Re:Oh boy, so much fail in one post.
So you don't dispute sea rise has been negative for about six years?
That's a start I guess.
The rest of your argument pretty much doesn't matter after that now does it? You haven't found fault with either the data or the logic here, and merely sought clarification of one part you don't understand.
So in case you don't resistant quite what what you're looking at, here goes.
Because nominal sea was was unchanged for about 8000 years, never went up, that was an error, and six years ago flipped when ice began growing again.
Perhaps I explained that badly in my post. Please allow me to try again.
If you look at the longer term map you can see the sea rise for the past 8000 years was pretty constant. Then, six years ago it began falling. I did not try to make a graph like that with only six years but if you were t try the tool at nasa to get just the last 10 years it gives you this, at least it did with my browser, why don't you try it?
Now, there were spurious reports of "sea rise" in Miami but not, only 50 miles away, in the Florida Keys it was not rising. This was found out to be because Miami was sinking, as was Beijing, by about four inches a year because the silly fucks pumped all the groundwater out. You know how nature abhors a vacuum.
Here's the long history of sea rise:
http://rs79.vrx.palo-alto.ca.u...
Look around 8000 years back. See that? That's the 33,3 century nominal sea rise.That stopped a few years ago.
Now, if you look at the same time period in the NSIDC graph is ice, you'll see there's a corresponding uptick in sea ice:
http://rs79.vrx.palo-alto.ca.u...Ok? So uptick in ice, seas fall. Got that now?
Nore that carbon dioxide also flarlines 6 years ago.Here's the stuff on the error in sea rise measurement in Miami:
Here's a picture of it:
http://geologylearn.blogspot.c...
Here's thr article in Nature about Florida.
http://www.nature.com/news/sou...
Here's the article about Beijing.
http://www.theweek.co.uk/73907...Here's the Co2 flatline stuff:
2015 CO2 has flatlined.
13 March 2015 Data from the International Energy Agency (IEA) indicate that global emissions of carbon dioxide from the energy sector stalled in 2014, marking the first time in 40 years in which there was a halt or reduction in emissions of the greenhouse gas that was not tied to an economic downturn.
http://www.iea.org/newsroomand...2016 CO2 flatlined for a second year in a row.
"The IEA reports that for the second year in a row, the world economy has grown while energy-related CO2 emissionsremained flat."
http://thinkprogress.org/clima...2017 CO2 emissions remain flat for a third year.
IEA finds CO2 emissions flat for third straight year even as global economy grew in 2016 17 March 2017.
https://www.iea.org/newsroom/n...MIT Technology Review also reported the fact CO2 stopped rising as well.
https://www.iea.org/newsroom/n...It doesn't matter what you "believe". The facts are, seas a falling, ice is growing and coe
-
Re:Btw that $ trillion got us less than 3%
By the way, after spending a trillion dollars in federal tax money (and more in state taxes), the US gets less than 3% of our energy from solar. So it has not worked.
Ok, let's take your numbers at face value. It looks like we spend about $250B / yr on energy infrastructure. So over the history of solar research (you don't give a timeframe so I'm spitballing 40 years), we've spent $1T. Over that same time frame, we've spent at least $10T overall on energy infrastructure. So, 10% of the budget to give us 3% of the energy - not great, but not ridiculous either. Especially considering that has recently become cheaper than most everything else, and so will come to represent a much larger percentage of power very soon.
I agree with you about nuclear, btw - we should build more plants and use it for our base load. But you shouldn't use fallacious arguments against solar out of your support for nuclear. It's possible (and logical) to support both.
-
Re:There goes the pension fund.
No, newer air conditioners are more efficient than the old ones in use now.
Average Chinese air conditioners are better than average American air conditioners for example. That will only get better as more newer ones are installed. -
Re:interesting? did you misspell obvious?
Anyway, AC will always only be a small fraction of electricity consumption.
So putting up that straw man makes no sense.
What makes you say that? 18% is a pretty significant amount. And thats in power hungry America.
EIA estimates that 18% of annual household electricity use is for air conditioning.
Just have a look here to see what the experts predict.
So putting up that straw man makes no sense.
It was an example of growing wealth causing a growing use of electricity (and consumption in general)
It was also directly in resopnse to Windy's post about AC sales.
How on earth is that a strawman? -
Re:175 GW would be roughly 23% of India's energy u
A comment almost completely devoid of information, probably because you'd rather not get it wrong yourself and look like a dick...
OK so attempt 2...
775 Mtoe = 9 013 250 GWh
according to
https://www.iea.org/statistics...
So to get GWh from a 100GW power station...
100GW x 24 x 365 = 876 000GWh100 * 876,000 / 9,013,250 = 9%
which is still not 23%
-
Re:The article is conjecture
I also have concerns about maintenance costs. Especially around batteries.
I don't think nuclear has problems due to nuclear weapons. I think it is separate in the public mind. Nuclear power has 3 mile island, cherynobl, fukishima, and nuclear waste disposal. Humans are sloppy and cost cutting when it comes to nuclear power. It's just not a good mix. And ratepayers see the surcharge on their bills and now know that old nuclear plants cost much much much more to decommission than they were told. They are paying for their parents artificially "cheap" electricity in past decades.
Coal has actually made more land uninhabitable due to coal seam fires but that doesn't get much press. There's also a big mercury bomb waiting to break from coal exhaust pre 2015. I was surprised to find many old plants were grandfathered and polluting as much as ever until 2015.
On africa, I did a little more digging and africa is way behind the rest of the world. Only 16 gigawatts of renewable energy added between 2012 and 2017. As compared to 328 gigawatts in China. So I agree, they are not doing well. And I realized I fell into the speculative trap in my prior african posts. Those are projections thru 2025. I actually had to dig a lot harder to get the historical 2012 to 2017 data.
China, the US and India account for 2/3 of renewable growth thru 2022 (a projection and so speculative but short term).
Here's where some of the new data comes from. I was trying to stick with historical data but 2022 is close enough we can verify that and it's probably more reliable than projections for 2040.
https://www.iea.org/publicatio...
On thing that interested me was that china's demand for solar recently exceeded it's production for solar. So that might tighten the global market short term.
-
Re:I don't have much of a problem with this
Look at the levelized cost of electricity (unit cost of electricity after factoring in all lifetime costs) for nuclear in the U.S. versus other countries like France and Japan. Globally, nuclear power is the cheapest. The high cost of nuclear power in the U.S. is self-inflicted by poor and over-regulation, not due to any inherent engineering problems.
-
Re: Still a very small segment
But anyone with some math skills will tell you that with a 50% annual growth rate it doesn't matter much what the current percentage is, it can become a significant fraction of the total within a few years.
Lack of infrastructure doesn't need to be solved overnight either. It took years for gas stations to appear when ICE cars first appeared. If there is a demand, chargers will appear at restaurants, stores, parking lots, etc. either to attract customers or for profit. It wouldn't be unreasonable to locate chargers on lamp posts for metered street parking and pay for it in the same way as the meter (coins, credit card or phone app).
Simple math can be too simplistic. Here's the Global EV outlook report from the International Energy Agency
https://www.iea.org/publicatio...Their projection is by 2060 EV's could account for 60% of PLDV in circulation. That seems possible, a lot can change in 42 years. We might even see something better than EV in that time.
As for the infra issues, sure it took years for gas stations to be everywhere. But EV's are competing with the current state of that infrastructure, not the infrastructure of the year 1910. I think existing gas stations would add charger stations if the charging time drops to 5 minutes.
-
Re:units failThe IEA.org page referenced in TFA doesn't mention it and the actual paper itself could be written more clearly, but I'm guessing that it's kWh/year...
Demand for energy for space cooling in the United States appears to have levelled off in recent years, mainly due to market saturation with improvements in energy efficiency largely offsetting the impact of population growth, migration to hotter parts of the country and rising outdoor temperatures. Demand over 2011-16 averaged 560 TWh per year, only 2.5% higher than over 2001-10 (consumption fluctuates markedly with annual variations in the weather). In 2016, cooling made up about 10. 5% of the total energy use in buildings in the United States , followed by Mexico ( 9.8 %), Japan (9. 5%), China (9. 3%) and Korea (8.5%).
The enormous disparities in access to space cooling across the world are reflected in per-capita levels of energy consumption, which vary from as little as 70 kilowatt hours (kWh) in India to more than 800 kWh in Japan and Korea and as high as 1880 kWh in the United States (Figure 1.9). Africa has some of the hottest places on the planet but AC ownership is still typically below 5%. Consumption of electricity for cooling there amounted to a mere 35 kWh per person on average in 2016. Even in Europe, which has a relatively mild climate, the average electricity consumed per person for space cooling is still more than all the electricity used per person in buildings in Africa, Brazil and Indonesia, which have much hotter climates and far greater cooling needs.
-
Re: Carbon taxing is worthlessYou really don't understand this at all. Electricity isn't the only use for coal. All the other uses were down.
China did not increase coal use by 5% in 2017. Stop with the lie.
Even though coal use for electricity was up(nowhere near 5%), it was up less than other things. And coal's percentage went down. China is getting cleaner. Nat gas for example was up over 10%China’s National Statistics Bureau said in January that the country’s total energy consumption in 2017 was up around 2.9% compared to a year ago, but coal’s share in total energy mix was down by 1.7%.
You are taking electricity's fossil fuel increase of 5.2 total , pretending it's all coal. And ignoring all the other coal uses that have fallen.
Around 15% of the increase in China’s electricity demand was due to higher demand for cooling, driven by a particularly hot summer. (This topic will be the focus of a forthcoming IEA report on how the projected growth in air conditioning usage around the world will affect global electricity demand). Despite continued reductions of coal use in buildings and industry, the growth in the power sector pushed up coal demand in China by 0.3%, after three years of declining demand. Despite this rebound, coal use in China remains below its 2013 peak.
So it's not a 5% increase for coal, it's only 0.3%. Why do you continue to post your lies?
It's not all doom and gloom like you think.
https://greenerideal.com/news/...The report said that while China was outstripping every nation in sight, investment in renewable projects in the UK, Germany and the US tailed off. The US saw renewable investment withdraw by 6 percent to $40.5 billion, and with the Trump administration adding a new solar panel tariff, jobs lost to the sector in 2018 will amount to 23,000. On the flip side, China was responsible for 45 percent of the $279.8 billion spent on all renewables, and more than half of all new global solar capacity.
AN INCREDIBLE wave of solar energy peaking in China has helped to put renewable energy ahead of fossil fuels use for the first time. A total 98 gigawatts of solar energy technology – with 53 gigawatts installed in China – outstripped combined coal, gas and nuclear energies.
https://www.cnbc.com/2018/04/2...
China maintained its position as a wind energy powerhouse, installing 19.7 GW, while the European Union added 15.6 GW of capacity, its best ever year. The U.S. installed a little over 7 GW of capacity.
-
Re: Carbon taxing is worthlessWhy do you persist with the lies Windy? This isn't the first time you have been shown facts and evidence
Despite continued reductions of coal use in buildings and industry, the growth in the power sector pushed up coal demand in China by 0.3%, after three years of declining demand. Despite this rebound, coal use in China remains below its 2013 peak.
-
Re:You're a little bit thick aren't you?
Laughable assertion again from you Windbourne, it's what I've come to expect.
Show a single post where I'm in favour of coal.Why would I push for China to build more coal? It's absurd. It's more absurd you would think that with no evidence.
The only lies and hypocrisy around here is you, as has been show repeatedly.
Still waiting for you to show me any lies I may have made.
I've shown many many of yours.Again stop trolling me, where did I mention coal was cleaner than natural gas. Just more lies you peddle as you follow me around
China's coal use continues to set records? Really, that's what you think? Because it's an obvious lie (one of many you keep peddling)
Stop with the lies Windbourne. It's just too easy if you are going to put them in every single post. It's not even a little bit of a challenge to find them as they are so obvious.Despite continued reductions of coal use in buildings and industry, the growth in the power sector pushed up coal demand in China by 0.3%, after three years of declining demand. Despite this rebound, coal use in China remains below its 2013 peak.
You really are a little child.
-
Re: 5% is nothing
I have said nothing of the kind. You continue to lie.
Your lies have been numerous and documented, you only add to them here.
You are yet to show any lie that I have made, despite your repeated claims.I have said that China continues to produce more than 2x the CO2 that America does, while their GDP output is far less.
But China doesn't produce more than twice, it produces a bit less than twice Americas CO2.
China's GDP output is also larger than the US.And America's transport CO2 rose far far less than what CHina's CO2 did. In fact, our transportation has risen for the last couple of years, BUT, our CO2 continues to drop, which is what matters. OTOH, your nation's CO2 continues to rise.
Facts are you transport has been getting worse for 5 years in a row with no end in site. Despite tougher fuel standards people are still switching away from cars and into SUV's and light trucks making the situation worse. (I'll note here that it's people choosing this despite businesses making more efficient cars and government enacting tougher standards.)
The fact that you continue to claim that Coal burns cleaner than nat gas shows how fucked up you are.
You keep telling this lie, but I never said it and you never show where you think I did. (How many lies so far from you in just this post?)
But China’s National Development and Reform Commission released detailed data this week showing that the country’s electricity consumption jumped 6.6 percent last year. Wind and solar energy grew quickly, but not nearly enough to meet the extra demand. Electricity generation from the burning of fossil fuels, almost entirely coal, rose 5.2 percent in China last year.
As I said before, because your nation continues to install loads more coal than AE, your new electricity continues to come from coal, and not AE.
More lies from you? Can you not read?
Around 15% of the increase in China’s electricity demand was due to higher demand for cooling, driven by a particularly hot summer. (This topic will be the focus of a forthcoming IEA report on how the projected growth in air conditioning usage around the world will affect global electricity demand). Despite continued reductions of coal use in buildings and industry, the growth in the power sector pushed up coal demand in China by 0.3%, after three years of declining demand. Despite this rebound, coal use in China remains below its 2013 peak.
Coal increased less than 1/2 a percent, yet you keep using ten times that number...And coal use peaked in China half a decade ago !!
Now, I know that your gov pays you to lie here, but others need to realize what kind of trash you are for trying to pretend that China is NOT a major polluter. Hell, your cleanest city is worse than any city in America or Europe.
It's quite clear who the liar is here WindBourne.
No one is pretending China is not a big polluter, due to being the global factory and also having the largest population. But it is you who is pretending America is not a major polluter.
-
Re:It's not actually hurtingActually that article is off slightly. The fact is, that Russia and OPEC have cut back production, though others esp US have increased. As such, there is a lot less oil on the market than should be at this time of year. IEA has the following report on oil, which is probably a bit more accurate than is Schenker on it (he is less specialized in oil than is IEA).
Political uncertainty in the Middle East has returned to the fore in recent days. As we write, uncertainty about the next steps in Syria and Yemen have helped propel the price of Brent crude oil back above $70/bbl. It remains to be seen if recently elevated prices are sustained and if so what are the implications for the market demand and supply dynamics. In the meantime, our overall view of global demand and supply growth in 2018 is unchanged from last month. For demand, early in 2018 stronger growth in the US was partially offset by weaker growth in China. India has seen a strong start to the year. Globally, we expect oil demand to grow by 1.5 mb/d in 2018. However, there is an element of risk to this outlook from the current tension on trade tariffs between China and the US, and we look at this issue in the demand section of this Report. For supply, our outlook for non-OPEC growth remains unchanged at 1.8 mb/d. Data for US production show that in January output fell by a modest 24 kb/d, much in line with our forecast with adverse weather playing a part. We retain our view that US crude production in 2018 will increase by 1.3 mb/d versus last year. However, there is concern about bottlenecks in takeaway capacity that have seen recent discounts for WTI Midland versus Houston widen to a record at nearly $9/bbl. This issue applies in Canada as well as in the US.
-
What a creative definition of "hurting"
Given that world oil production is around 35 billion barrels a year, 279,000 barrels isn't even a blip on anyone's radar.
-
Re:Gas turbine peakers
>> Here's my prediction: everyone alive today will be using electricity from fossil fuels their entire lives
That's already very wrong today. A quarter of humanity gets electricity from renewable. statistically. In 2016.
Renewable electricity: 24,3% in 2016 including biofuels.
Fossil electricity: 75,8% in 2016 including nuclear.
https://www.iea.org/newsroom/e... -
Re:CO2 ppm - next target
Humanity could fix the CO2 global warming issue as well, faster than expected, if united in focus on changing the current status quo.
Unlikely. The ozone layer was badly affected by a few chemicals for which we found alternatives. The vast majority of our energy production comes from fossil fuels and there's more people who want a higher standard of living every day. Even with a massive increase in renewable energy, green technology etc. total emissions are going up and will likely continue to rise as a billion Indians follow China, they're now roughly where China was 25 years ago. You can get a big report here (PDF) that'll break it down in more detail, long story short bringing the rest of the world up to western standards of living is another +50-100% added to CO2 emissions. Those who want to make cuts just draw lines downwards and ignore that there are huge structural reasons for increases that need to be offset before we're even stable.
-
Re: Not a natural result of unrealistic regulatio
As an "open minded engineer" you should read these reports.
https://www.ing.com/Newsroom/A...
https://www.bloomberg.com/news...
https://www.iea.org/publicatio...
https://www.bloomberg.com/news...
https://www.bloomberg.com/news...
http://inhabitat.com/stanford-...I am already rich and have no need to take your money so I will not accept your bet.
You, OTOH, might find cause to divest from oil and fossil cars after reading these reports. It might save you some money. -
#fakenews
The story is a rip off of this http://www.businessinsider.com...
The problem with this theory is that electricity is only 20% of mankinds energy consumption https://www.iea.org/publicatio... each panel requires 20 grams of silver to build https://www.usatoday.com/story... so to build this solar farm would require 7.2 times all the silver on planet earth.... https://www.nationaleconomicse...
But Elon Musk, who's claim to fame is that he has fleeced more taxpayer dollars than any person in the history of mankind said it, so it must be true, right? -
Re: The Art Of The Empty Gesture
the US military uses 1/4 million barrels of oil a day protecting "freedom"
Citation please.
The US Department of Defense. Annual Energy Management Report, and the Operational Energy Strategy.
World oil production is 96 million barrels/day
So you could look that up, but won't look up the US Military's daily consumption?
It's been reported for DECADES!
-
Re: The Art Of The Empty Gesture
the US military uses 1/4 million barrels of oil a day protecting "freedom"
Citation please.
World oil production is 96 million barrels/day
-
Why does this keep being reported as a good thing?
Improving efficiency in energy production means generating the same amount of energy with fewer jobs. Solar provided 0.45% of the world's energy in 2015. If it needed 3 million workers to do this, then providing 100% of our energy with solar would require 667 million workers, or 8.9% of the world's population.
When India was building a dam, the chief designer toured the construction site and noticed men digging with shovels while the heavy earthmoving equipment sat unused. He asked his guide from the Indian government why they weren't using the equipment. The guide explained that this project was as much about creating jobs as it was constructing the damn. The designer replied, "Then why don't you have the workers digging with spoons? You could employ a lot more people that way." -
Re:19th and 20th century powerhouse
China is the world leader in solar installations
https://en.wikipedia.org/wiki/...
As of 2014 China had 23% of total electricity generated by renewables:
http://www.iea.org/statistics/... -
Re:Will these small countries matter?
Except " China alone is responsible for 40% of global renewable power growth" in 2015, with the caveat "that represents only half of the country’s electricity demand increase."
-
Re:New Headline
Note that wikipedia has undisclosed bias in several sections so refer to the official policy for questions.
-
Re:Political Gamesmanship Of The Moment
You really need to read more. More than 30% of Finland's energy already comes from renewable sources, and fossil fuels are expensive (in terms of security cost as 75% of Finnish coal comes from Russia) or logistics (no local coal mines, all must be imported). Oil has similar problems (~90% from Russia) as does natural gas (100% from Russia), but fortunately local nuclear power will make up 60% of all energy needs, which combined with normal growth in renewable production over time allows for elimination of fossil fuels in power generation.
-
Re:Let's see how they like paying for renewables.
Nope. Read chapter 9.
-
Re:Convince me of realistic solutions
Existing generators lobby against new technologies being implemented, whether it be through lobbying efforts to get laws passed or influencing RTO stakeholder processes to ensure those technologies are at a disadvantage in unregulated markets (making it harder for them to earn capacity revenue for instance). So your assertion that carrot and stick aren't needed is naïve.
Continuing, incremental improvements in renewables and battery technology, along with an increased focus on energy efficiency will be enough to reduce a countries emissions significantly (whether it is quick enough depends in large part on the will of the people to embrace the changes rather than forestall them). Here are some sources showing the progress we have been seeing in the US already. As you can see from some of those graphs, we are hitting the knee of the curve on wind and solar, and those technologies are new enough that the curve should have a while before it tapers off into an S-curve.
-
Re:Renewables will never work
The small fraction in that case would be 23%, not 2/3. Because nuclear, while not a fossil fuel, isn't a renewable either, and that's what the op was talking about.
That said I actually think 23% is a pretty impressive - at least until you remember that electricty is only a smallish proportion of total energy use. I found this diagram helpful in showing the way things are:
-
Re: Pretty sure I read this story last decade.
You think nuclear plants are available 24/7? Historically, they've managed less than 62% of that. Coal is even worse, at under 45%. Yet we've managed OK with those.
Regardless of what type or mix of generation we choose, it obviously needs redundancy and wide distribution - which itself smooths out the variability of renewables too. The IEA has no problem with the energy security of renewables.
-
Re:Like most of Earth's existence?
CO2 Emissions have been flat for the last two years, Decoupling of global emissions and economic growth confirmed, BAU is now less than the Modellers foresaw.
-
Re:The denialists need to be dealt with somehow.
If the science is in, then why haven't the acceleration of emissions stopped?
Sorry but the facts are,
Global emissions of carbon dioxide stood at 32.1 billion tonnes in 2015, having remained essentially flat since 2013. Decoupling of global emissions and economic growth confirmed
emissions are not accelerating
Didn't everyone agree? Isn't it settled science? Or are you saying that everyone who drives a car is a denialist? Money talks. People don't REALLY believe in AGW.
If you look at the Map you'll easily see that the most CO2 is in the Sahara Desert, followed by the Indian Subcontinent and South-east Asia. None of these places are where Evil(tm) white people live. Australia where they whine the most about reducing CO2 emissions is actually a CO2 sink!
It's not getting warmer, it hasn't for 18 years, CO2 isn't going up except for a little out-gassing from the ocean due to the recent El Nina, the Alarmist narrative is coming apart at the seams. They should pull an Obama move, and declare victory and just walk away with their tails tucked.
-
Pipe dream
One look at page 6 of this report proves this article wrong.
http://www.iea.org/publication... -
Re: Newsflash
There is a considerable history of ineffective and costly policies here.
In who's opinion; yours? You're still not citing any actual studies. I ask again; where is your evidence?
In contrast, it appears those policies are already starting to work, despite intransigent resistence from vested interests and people such as yourself. -
Re:Ridiculous conclusionOn the electricity generation side of the equation, it worth to look at the World Energy Ooutlook 2013 report from the International Energy Agency (the latest report is available at a fee). http://www.iea.org/publication...
On page 175, you can look at the generation sources and the projections for 2020 and 2035 depending on a current, new or agressive policies to move toward renewables or at least reduce the fossil fuels demand. In 2011, 68% of the electricity produced in the world was from fossil fuels. The projections in the most agressive case for 2035 is 34% of the worldwide electricity will still be produced burning fossil fuels.This is after two decades and half under an agressive and optimistic scenario.
-
Re:Problems, problems....
Actually, economists have been saying for decades that a price on carbon is the most effective way to reduce emissions with least impact on the economy. And increases in efficiency have saved hundreds of billions annually.
Further, we've already had tech breakthroughs in energy production, with solar and wind to name a few. These have allowed us to decouple emissions growth from economic growth for the first time in history. With renewable energy prices still dropping and storage technology improving fast, even fully-green baseline power is already achievable; no further breakthroughs required, and we don't need to slash our energy consumption either.
For the record, I believe nukes should still be on the table, as there are cases where they still make the most sense. But their advantages have to be balanced against their price (both full-lifecycle cost, and potential failure risks), so I don't expect them to be widespread.
-
Reserves [Re:buy oil]
With no new exploration, oil production would eventually decline... but not "within 2-3 years, 5 years tops". It currently takes typically ten years to go from discovery to production! Oil exploration now won't have any effect whatsoever for ten years (although if the incentive were high, it could be shorter).
In any case, proved reserves (the oil that we already know is there, no exploration needed) are currently estimated at 1656 billion barrels, while world usage is 96 billion barrels per year. So with no new oil fields developed at all, it would take 17 years for production to stop.data:
Reserves: https://www.eia.gov/cfapps/ipd...
world consumption: https://www.iea.org/aboutus/fa...