 Slashdot Mirror
Domain: noaa.gov
Stories and comments across the archive that link to noaa.gov.
Comments · 2,602
-
That's how bad the situation is...
That it's being considered really shows how bad the drought situation in Texas is. I'm sure the quality of the water will be fine, but for people to mentally get over the stigma requires some serious problem that needs to be addressed. Pretty much the whole state is "hell" and relief does not seem anywhere in the distant future: http://www.cpc.ncep.noaa.gov/products/expert_assessment/seasonal_drought.html
-
Re:Where the fuck are Minnesota and Wisconsin?
This range pretty much includes all Europe (except Portugal/Spain/Italy/Balkans), Russia, Mongolia, and Northern parts of China & Japan.
This is correct, but it's not correct to assume that people in these areas can expect to see an auroral display just because one is visible in Minnesota. Auroral displays are responsive to geomagnetic, not geographic, coordinates, and the geomagnetic coordinates swing south over North America and north over Asia. One would have to be above 60N (geographically) to see an auroral event in Asia visible in Minnesota at 45N.
-
Re:no Data "Studies"
Are you sure about those records?
From NOAA's National Climate Data Center list of temperature records in July 2011: "Out of a possible 173,311 records: 1,564 (Broken) + 1,086 (Tied) = 2,650 Total"
-
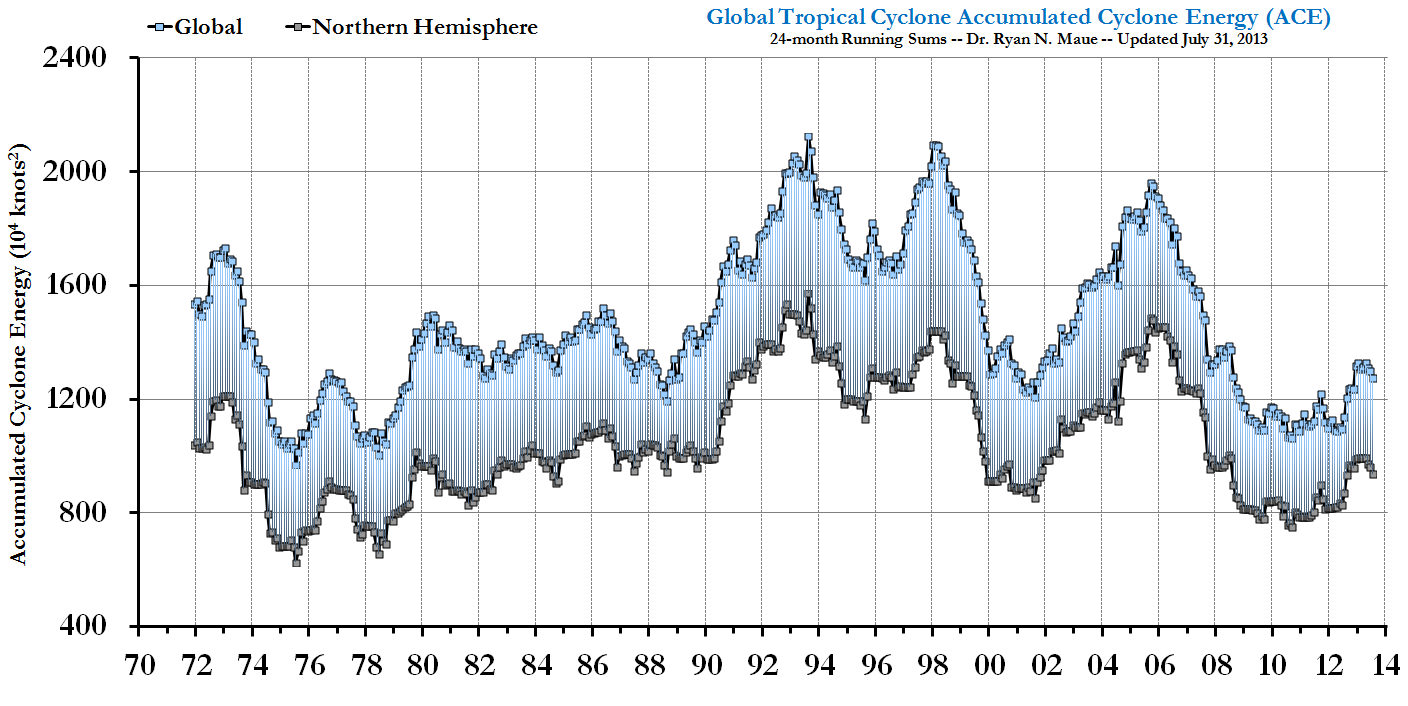
Re:Follow the data!
Working link to Maue's graph on the COAPS site. The graph is of cyclonic energy accumulated over the Northern Hemisphere and Globally. Meaning that each data point represents the average for the month over very large areas. Since by definition an increase in extremes does not affect the estimation of centrality of curves, this graph does not support your point. It is meaningless. A car analogy: in a conversation about how fast various cars can go, you use the rated MPG to support your position.
Working link to NOAA's graph of strong tornados on the National Climatic Data Center web site. The first link provides no clue as to the context in which the graph is meant to be read. Eyeballing the graph itself, it does appear that while the mean number of nasty storms may be declining, there is more variablity from the mean in later years than in earlier ones. Which supports the premise that there is an increase in extremes.
I have other things to do and cannot take the time to walk through the third failed link, especially as I think it is highly likely that it, like these two, will provide only smoke but no new light on the discussion.
I have no idea why I and so many other persons can use links on Slashdot while you cannot, but I am confident it is not something that Slashdot is doing to you alone. It looks like PEBKAC.
As to user id numbers:
I was active on Slashdot from June, 2002 to about a month ago as MysticGoat, account #582871. I am continuing from this time forward with this account, under a nickname that is very close to my name in real life.
That was my first journal entry on this account, in 2009. So the Slashdot presence I am willing to admit to is not that much younger than your own. I honestly do not recall what my first account or user id was: all that got irretrievably lost in some personal chaos during the 2001 - 2002 era.
-
Re:Follow the data!
more extreme weather
Really? It's not visible in the data:
http://www.coaps.fsu.edu/~maue/tropical/global_running_ace.jpg
http://lwf.ncdc.noaa.gov/img/climate/research/tornado/tornadotrend.jpg
http://www.norman.noaa.gov/wp-content/uploads/2009/03/ustornadodeath2000_26874_image001.png( I have no idea why Slashdot messes up the links, sorry - copy/paste)
-
Most of the Data is Freely Available
Like the article says. Most of this data was already publicly available online:
I took this data and plugged it into Cornell’s free data analysis software Eureka and it found a clear warming trend in the data. I'm not statistician, so I was just playing around, but I have yet to see anyone use this data to argue for anything but a warming trend (Note: I have seen skeptics use parts of this data to show short-term cooling trends). My favorite email attacking the results the software gave me was that I had "manipulated" the data by copying-and-pasting it into Excel.
I'm glad more data is being made publicly available, but, like someone else said, that just means it's time for the skeptics to move the goalposts again. Either put up a competing hypothesis that explains the data or shut up.
-
Re:Just a capsule...??????
Seriously, these things are in different orders of magnitude entirely.
Hurricane uses/releases about 5.2 x 10^19 Joules/day. OTOH, "In 2008, total worldwide energy consumption was 474 exajoules (474×10^18 J=132,000 TWh)."
So, roughly, one day of a single hurricane equals one year of humanity, energy wise.
Seriously, this calls for a bad car analogy. Being worried about the amount of energy used by any conceivable number of Mars missions is like being worried that if you wax your car after washing it, that will make you run ouf of gas when you try to accelerate all that extra mass to normal driving speed.
-
Re:Scrubbers: A 1970s Tech Still Absent in China
I retract that post. Looks like I was wrong.
-
Re:News Flash
Can you name a single place in the US that isn't prone to some natural disaster? Earthquakes in California, hurricanes and tsunamis (remember, most of hese floods are worse than anything in over 100 years) on the coasts, tornados in the midwest, floods near rivers. No US citizen is safe from natural disasters.
While certainly there is nowhere with 0 risk, it would be silly to claim that the risk can't be mitigated greatly by choosing a safer location. A few minutes with google returned several good lists of disasters:
http://www.fema.gov/news/disaster_totals_annual.fema
http://www.ncdc.noaa.gov/oa/reports/billionz.html
http://en.wikipedia.org/wiki/List_of_natural_disasters_in_the_United_States
While you are right that you can find virtually any area in the US on those lists, there are some areas that show up over and over again. Those are the regions to avoid. -
Re:Scientific debate, huh?
When a single-year's volcano eruption (Pinatubo) put out more CO2 than all of humanity, ever?
This alone is already blatant nonsense. Educate yourself.
http://tamino.wordpress.com/2011/06/19/volcanic-co2/#more-3906
Also, if volcanoes were so significant, how come the CO2 graph is rising so gradually every year, instead of showing big steps after each eruption ?
http://www.esrl.noaa.gov/gmd/webdata/ccgg/trends/co2_data_mlo.png
This is even more obvious in a longer timeframe:
http://www.pbs.org/wgbh/warming/art/graph4.gifDoes the 20th century have a huge volcanic activity compared to all the half-million years before that ?
-
Re:And we know this because...?
Problem being if YOU actually do pay attention to the sun, it's blindingly obvious that there has to be something else going on, in addition to the sun.
Reason being is that since the 1970's or so, solar output has been averaging flat-to-decreasing.
http://i.imgur.com/E2ijh.png
http://i.imgur.com/XbgJM.pngMeanwhile, if you look at the incoming sunlight, the outgoing heat, and the returning heat. It's pretty damned obvious to see that nearly all the increase in returning heat is in the wavelengths you'd expect CO2 and CH4 to block.
http://www.skepticalscience.com/empirical-evidence-for-co2-enhanced-greenhouse-effect-advanced.htmHow much more obvious does it need to be?
__
(And incase your sunspot headlines are still stuck in the year 2009, here's what it's currently doing)
http://www.swpc.noaa.gov/SolarCycle/sunspot.gif -
Re:The data shows...
That's an interesting claim. That's the fabricated evidence I usually see in arguments against global warming. In fact, 2010 tied 1998 as the warmest year on record according to the NOAA. You can see the instrumental temperature record to see the warming of the past several decades. If there were good evidence against global warming, you wouldn't need to fabricate any, would you?
-
Inferring that climate change "caused" something
Weather is not the same thing as climate, dumbass!
However, one can say that a particular event is more likely to occur under one scenario (no climate change) than under another (climate change), and this is a conceptual approach being taken to say whether climate change "caused" a particular event or not.
In the case of the extreme tornadoes this year, very preliminary analyses say they're not easily attributable to climate change.
-
Re:What video
The best videos, processed and raw, are available in javascript, flash, and mpg from the lockheedmartin/solarsoft group that handles SDO AIA: http://sdowww.lmsal.com/sdomedia/ssw/ssw_client/data/ssw_service_110606_235609_98013/www/
If you look at the proton monitors in L1 http://www.swpc.noaa.gov/ace/SIS_24h.html and earth geosynchronous http://www.swpc.noaa.gov/rt_plots/Proton.gif orbit there is a very suggestive correlation between this flare and a flux of high energy protons! The timing is about right and the flare itself is positioned such that the parker spiral http://spaceweather.uma.es/solarstorms_files/figura1bc.JPG of the interplanetary magnetic field http://www.youtube.com/watch?v=2434rAbImf0 would put earth in sun spot 1226's path http://i.imgur.com/ZIffl.gif. This tight coupling of timing between the flare time (~06:30:00) and proton arrival (07:00:00) suggests not a coronal mass ejection (that takes days) but instead of weakly relativistic particle beam traveling down the magnetic field lines to earth in only tens of minutes. This interpetation is confirmed by the UMA automatic solar energetic particle forcaster http://spaceweather.uma.es/forecastpanel.htm and later in the day mentioned by a press release http://www.physorg.com/news/2011-06-unusual-solar-storm-disrupt-earth.html.
-
115 MPH STRAIGHT-LINE WINDS
I've personally witnessed all of the types of destructive
http://www.windlegends.org/windnames.htm
winds. Front row to over a dozen hurricanes, all the way
up to 5. Seen a handful of twisters and waterspouts...http://www.wrh.noaa.gov/psr/general/history/
... and I've seen many haboobs and the winds that
are associated with it. If you aren't planning on high
speed straight-line winds, you're just too stupid to be
in the business of planning."Peak wind gusts of up to 115 mph were measured at the Deer Valley Airport, and the storm caused over 160 million dollars of damage over several west valley cities, including Buckeye. The measured speed of 115 mph set the all time peak gust record record for Phoenix, as well as for the entire state of Arizona!
It should be noted that macroburst winds, unlike tornadic winds, are STRAIGHT-LINE winds - they do not contain strong rotation such as would be observed with the passing of a tornado. These strong winds descend from the lower levels of a thunderstorm, then hit the ground and spread outwards, moving in a straight line."
-AI
-
Re:Weather
Severe Thunderstorm Watch - Not warning. More info from the Storm Prediction Center.
Current NYC Weather Info: http://www.erh.noaa.gov/er/okx/
-
Re:Weather
Severe Thunderstorm Watch - Not warning. More info from the Storm Prediction Center.
Current NYC Weather Info: http://www.erh.noaa.gov/er/okx/
-
Re:Immediately followed by killer tornadoes
Well, thank goodness we are finally solving our global warming problem, since the deaths per year from Tornadoes continues to drop. Although this years tornado outbreaks have drawn more news exposure, mostly because they happened to hit large cities, this years tornado season has actually been less severe than usual.
Okay, first of all, remember that the number of tornado deaths has been falling pretty consistently since the mid-20s thanks to early warnings.
In 2011 as of May 26th there were 512 deaths already (incl. 132 in Joplin), which already makes it 7th deadliest year since 1875. And even if you ignore the victims in Joplin, it would still already be the 12th deadliest year - after 5 months.
-
Re:Immediately followed by killer tornadoes
That's interesting, because that was the exact opposite of what I have read. According to the another article there have only been 3 years (not including 2009, 2010, and 2011 since the article is from 2008) since 1974 where more than 100 people have died from Tornados: 1984, 1998, and 2008. Isn't the death toll over 500 now? Apparently it was the highest death toll since 1953 when that article was written. this article says this April set the record for most Tornados in the U.S. in April, and may set a new monthly high record. Wikipedia says "2011 has been an exceptionally destructive and deadly year for tornadoes" and "It is also the deadliest year in the United States since 1936, due mostly to the 322 tornadic deaths in the April 27 outbreak and the 140+ tornadic deaths in the May 22 outbreak". According to this post on the NOAA Severe Weather Blog, this year will likely end up being the 4th deadliest on record.
Interestingly enough, May may actually end up with a below average number of Tornadoes due to 3 weeks of relatively calm and stable weather, but I think a record April is making up for a below average May, especially when you consider the death toll.
-
Re:3 degree change
Your *data* is out of *date*.
dig here: http://www.spc.nssl.noaa.gov/climo/historical.html
or get a summary here: http://tamino.wordpress.com/2011/05/25/year-of-the-twister/
or google
If you don't *know* that global warming causes more and especially more violent storms then I suggest study a bit meteorology. Actually it should be a no brainer to understand this simple correlation.
-
Re:Climate Change Deniers
Water vapour feeds storms. Try a quick google search of that last sentence for more info.
Let me restate - while water vapor is necessary for thunderstorms, extreme weather events, including those without precipitation, such as tornadoes, are driven by pressure and temperature differentials. Reducing those differentials should lead to milder weather, not more extreme weather.
http://www.drroyspencer.com/2011/05/todays-tornado-outlook-high-risk-of-global-warming-hype/
You have nailed it. We have significantly raised the ocean surface temperature.
Properly stated, ocean surface temperature has always changed:
http://www.nodc.noaa.gov/OC5/3M_HEAT_CONTENT/heat_content55-07.png
And even dropped in the presence of ever higher CO2 concentrations. That all being said, why would we assume that the atmosphere is driving ocean temperatures, rather than the other way around? The heat content of the ocean outweighing the heat content of the entire atmosphere by over 4000:1 seems to be an indication that if were were to look for *causes*, they would be oceanic rather than atmospheric. As examples, see PDO, ENSO, ADO, etc.
The other natural variables create wibbles and wobbles that dwarf any trend of less than 30 years.
Why would we assume that a trend of 30 years or more eliminates any trends caused by natural variables?
We clearly haven't hit any upper limit, and accelerated output of GHG as well as feedbacks are clearly more than making up for the logarithmic rate.
I'm not sure how you can say that. The logarithmic rate will always limit any linear progression (which, if you look at atmospheric CO2 levels, is what we've been experiencing). Only a geometric progression (and a steep one at that), would "make up" for the logarithmic rate.
That the temperature is increasing. I was making the exact same point.
I'm not sure you are. I believe your point is "the temperature is increasing *and* it's because of human produced CO2". On any given time scale, understanding that climate naturally changes, I could agree with the first one (and it's corollary "the temperature is decreasing").
Put another way, it seems that the presence of a "hottest year ever" indicates to you that it must be so because of artificial influences on the climate, rather than just a statistical artifact that we see during points of warming throughout earth's history. Because the "hottest year ever" is necessary for the CAGW hypothesis to be correct, it is subject to a great deal of data massaging - but let's not mistake *necessary* for *sufficient*.
As you have noted previously we should be expecting the temperatures to be dropping.
And on the scale that matters to me and my neighbors, we have been seeing dropping temperatures. While granted, regional temperatures can buck the trend of any artificial "global average temperature", it also brings up the distinct possibility that the "hottest year ever" is simply a statistical artifact, and a politically motivated one at that.
They can adjust their global average temperature to whatever they want, but they can't stop it from being colder all across the US, and other places around the world where people actually live and experience the weather. I wouldn't go so far as to say we can definitively detect a global average trend one way or the other -> the whole sensor station network for global temperatures is woefully lacking for any sort of confidence.
I will only note that skeptics Richard Mueller, Roy Spencer, and Anthony Watts have all performed independent validation of the temperature
-
Re:Climate Change Deniers
The link to the paper comparing surfacestations.org well/poorly placed stations is here.
The extended warming in the 1700's coincides with the Sun coming out of the Maunder minimum as do other temperature changes coincide with levels of solar activity. That is not the case now, temperatures have been increasing despite solar activity not increasing.
So your null hypothesis is to assume that it's all magical, that we don't know enough to attribute the temperature change to anything? Scientists would beg to differ. The radiative properties of CO2 are well known. Certainly they get modified when they are mixed with other gases in a dynamic atmosphere but they don't go away. Scientists didn't decide that CO2 was the cause of global warming and then look for evidence to support that supposition. Instead they asked what are the factors that go into explaining the temperature on the surface of the Earth. They have found that after changes in insolation CO2 is the biggest factor. If you want to dispute that you have to come up with a better scientific argument than they have.
Clouds effects on global warming has been pretty intensely studied for the past decade. Dessler (2010) used cloud measurements over the whole planet from the CERES satellite from March 2000 to February 2010. He concludes that although a small negative feedback is possible cloud feedbacks are most likely positive. He also says a negative feedback from clouds strong enough to overcome the positive feedbacks is not supported by his observations. I wouldn't call that *completely* uncertain despite what Anthony Watts says.
If the ocean is absorbing heat from the atmosphere it's going to get warmer. The ocean is not an infinite heat sink. Warmer oceans mean warmer atmospheric temperatures. Because of the buffer effect of the oceans atmospheric temperatures lag what they would be relative to the radiative balance of the planet by 30-40 years but the atmosphere will catch up eventually.
You really ought to drop the undersea volcanoes argument. It is a hypothesis with no evidence to back it up. It makes it sound like your grasping at straws to support your position.
CO2 in the atmosphere is NOT limited by temperature. Ocean temperature does affect the absorption/out-gassing of CO2 but there is a balance between the ocean and atmosphere based on the partial pressure. No matter how high high the level of absorbed CO2 in the ocean if the partial pressure in the atmosphere is high enough the ocean will absorb more of it or if the partial pressure is low enough the ocean will out-gas it. There is no possibility of supersaturation of CO2 in the atmosphere under current conditions on the Earth. The atmosphere could be 100% CO2 and it still wouldn't precipitate out. The maximum percentage of H20 in the atmosphere is around 4% at the surface before it starts to precipitate out but as you go higher in the atmosphere that number gets smaller because of the colder temperatures. Above the troposphere there is more CO2 than water vapor in the atmosphere.
I guess you're calling my invoking of the second law of thermodynamics a toy model. Yes, it doesn't explain all of the complexities. It's just the place to start from and you can't override it.
What solar predictions? I'm not aware of any theory that predicts what the Sun is going to do other than to keep doing what is has been. If you can believe in solar predictions you ought to be able to believe what climate scientists say as well.
If I live another 40 years I'll be on the verge of being one of those celebrated centenarians. Wish me luck.
-
Re:can someone please explain a couple holes I see
I haven't read and cant give specific evidence... but neither can you. That should have told you to go do some research and make an informative post, but instead, you've decided to maintain your ignorance and maintain ours to boot.
Oh wait, ten seconds on google and you could have seen: http://www.ozonelayer.noaa.gov/science/basics.htm
Go read it! -
Re:No it did not.
No, the data you link to is the data that's been massaged. Specifically, it's been highly averaged. The actual AVHRR data has much better resolution. Play around with the plotting tools at ESRL : http://www.esrl.noaa.gov/psd/cgi-bin/db_search/DBSearch.pl?Dataset=NOAA+Interpolated+OLR&Variable=Outgoing+Longwave+Radiation
That's exactly what I *did* use to create my figure. Though I had to use uninterpolated OLR data to get March 2011 data. Both data sets we've linked to are at 2.5 degree resolution. That doesn't prove that the paper's authors don't have access to higher resolution data, but no high-res data is available at the link they cite, and, I find it extraordinarily suspicious that their little blobs of peak OLR are spaced at exact multiples of 2.5 degrees apart, and lie exactly on the grid boxes for the ESRL data.
You can generate figures for yourself that match the article's figures very neatly.
No I cannot. Or rather, I can, but only by engaging in statistical and graphical flimflammery. You try it.
As for the rest of your points:
1: Yes, contentious, but I'm quoting the geology party line here. The extraordinary claim is that despite seismological evidence to the contrary, earthquakes are preceded by warning signs: that claim is the one which requires extraordinary proof.
2: Very clear. The fault in question is in 7 km of water, close to a gigapascal of pressure. Because of Henry's Law, you don't have gaseous bubbles of anything at that pressure: all gases are in liquid solution. Thus, the gas molecules move with the water. Which is sloooowly.
3: The figures do not match the expected behavior of a plume of material released from a point source on the Japanese coast.Oh, while we're quoting figures in the article, how about Figure 3, which show OLR "events" in Tohoku which are as large or larger than the ones they're interested in, occuring on Feb 22, 2011, and Jan 28, 2010. These are ignored because they're not larger than the error bars. But these error bars are bullshit: do we really believe that the natural variability of weather on March 9 is one sixth as much as on Feb 24? I sure don't. They're computing standard deviations using 6 data points, which is a recipe for disaster.
-
Re:stop -- this sounds like investment?
Yeah. Cut NOAA funding. Who cares about tsunamis anyway? Whoops! No more tornado warnings either?
Now all those God-fearing Tea party rednecks can watch their mobile homes fly away.
the mobile homes fly away anyways? you're not helping your point. besides, good liburuls r supposed to "care" for the downtrodden and poor working schlep. you're letting your elitist stripes show.
-
Re:stop -- this sounds like investment?
Yeah. Cut NOAA funding. Who cares about tsunamis anyway? Whoops! No more tornado warnings either?
Now all those God-fearing Tea party rednecks can watch their mobile homes fly away.
-
Re:real scienceWow. There is so much wrong in all of your statements, I don't know where to begin: "Observed Reality" and "CRU Propaganda"
From the NOAA website where that graph came from:Both use the same land-based thermometer measurement records from the GHCN, but the records contain some differences. These differences are due to different approaches to spatial averaging, the use and treatment of sea surface temperature data (from ship observations), and the handling of the influence of changes in land-cover (i.e., increases in urbanization). However, both show the same basic trends over the last 100 years. The units shown are departures from the 1960 - 1990 period.
So you either did not read clearly what NOAA said and/or made up your own conclusions based on nothing but your perceptions.
No delusion here, look at the last five years of these two graphcs . .
Selectively focusing on the last 5 years and ignoring the larger trend of 145 shows that you don't understand basic tenets of science on interpolation. By your logic, the rent money and bills that I paid yesterday means I will be broke by Monday.
-
Re:Here is the science in a nutshell
I see two very similar graphs. What's your point, exactly ?
The small differences are explained on the page where you found it: http://www.ncdc.noaa.gov/paleo/globalwarming/instrumental.html
-
real science
No delusion here, look at the last five years of these two graphcs, let's call the top one "Observed Reality' and the bottom one "CRU Propaganda Factory's desperate attempt to prop up the 'hockey stick''"
http://www.ncdc.noaa.gov/paleo/globalwarming/images/temp-anom-larg.jpg -
Here is the science in a nutshell
CRU alarmist propaganda at bottom, reality at top, argue with the NOAA if you don't like the graphs:
http://www.ncdc.noaa.gov/paleo/globalwarming/images/temp-anom-larg.jpg -
Re:Global warming?
A weird coincidence
Trend of strong to violent tornadoes 1950 - 2007 courtesy of NOAA. -
Re:Scientific American throws in the towel
A lot of the "Man is causing Global Warming" science is hard to falsify, but that's because the people doing that research are hiding their original numbers and only using massaged data to "hide the decline" in the amount of Global Warming taking place.
Pure and utter bullshit. Who is "hiding their numbers"? I'm guessing you're referring to the "Climategate" incident in 2009 based on your particular use of the phrase "hide the decline", an oft-repeated-by-the-denialists phrase supposedly indicating it has something to do with the scientists at the CRU actively trying to hide data within graphs.
As oft-repeated as it is, though, it's been even more oft-debunked, so I won't bother even addressing how clueless you are when it comes to this "scandal" (hint: if there was some "conspiracy" to falsely prove climate change, where in the e-mails does it mention said conspiracy? You have a lot of misunderstood phrases taken out of context, but nothing along the lines of "Alert Lord Gore, inform him the coverup of the data is complete! His plans for world domination will come to fruition!!!" anywhere within.) Instead, I'll issue a challenge you'll never take up: The original data for most of what was being worked on in the hacked e-mails comes from weather station data that's freely available at the Global Historical Climatology Network or the National Centre for Atmospheric Research. Feel free to contact either of them and ask for a copy of station data covering the last 100 years and do your own analysis and thus falsify the theories. Recommendation, ask nicely. Like every other person on the planet (who doesn't live on The Jersey Shore), scientists don't like douchebags.
If you can prove the analysis, you'll be the hero of not only the denialist movement, but the scientific community as well. After all, science #1 goal is to be shown it's wrong because it's in doing so that we learn. But, we all know you'll never do that.
For once, a scientist put out an easily falsified Global Warming theory, that is "By 2010, there would be 50 million climate refugees, and they'd come from these specific places." 2010 has come and gone, and there aren't 50 million climate refugees. Therefore, his falsifiable statement has been proven false.
Well, that's true...except for it all being completely false. Read the articles mentioned and read the first comment to see that no scientist actually said that.
It means giving up whatever money was set aside to deal with the climate refugees.
There was money set aside? None of the articles mention it. I realize it's a moot question, but...do you have a source for this?
It means maybe next time, listening to the people who say that there won't be 50 million climate refugees in the next five years. It doesn't mean mocking the people who disagreed with the original prediction for something that has nothing to do with what they said or did.
But, when one group goes out of their way to be wrong so often, you just have to mock them. I know I do. Oh, and I can't find any reference to anyone disagreeing with this until 2010. Apparently, for a group that's ordinarily so vocal in their ignorance, the denialists were silent on this "issue" when it first appeared. Perhaps it's because in 2005 people actually knew that no scientist said there'd be 50mil climate refugees and saying so then would invite a lot of backlash for such a gross misreading? Mention it now, and pretty much no one but the denialists even notice.
A challenge to a theory isn't "an attack on science," but refusing to let go of an idea that has clearly been proven false is.
I couldn't agree more, and yet...here you are defending it.
-
Re:You really need to ask?
1) I'm not asking for a "proof", just a hypothesis. One hypothesis I've heard is that the warming will cause an increase in humidity, which will cause extra clouds, and the clouds will reduce the sunlight warming the Earth. To my knowledge, however, we haven't observed this increase in clouds.
2) We certainly have proved the warming is happening. That's why we're so sure AGW is a good hypothesis, because observations confirm the predictions it makes. Without these observations, it would be mere speculation, as is the idea in #1.
Now if you have no evidence to falsify AGW and no alternative hypothesis to explain the warming, I have to accept the one hypothesis we do have evidence for.
-
Re:United Nations University, Not the UN
No, it's the continued observations of the warming that has been predicted for over 100 years. If we do not see the predicted warning, then feel free to say the researchers were wrong.
-
Re:United Nations University, Not the UN
The data have always showed warming due to burning fossil fuels, ever since Arrhenius predicted it over 100 years ago. The impending ice age approaching was hypothesized by researchers doing exactly what you're doing -- instead of looking at the global temperature trend looking at small geographical areas. Clearly global temperatures are rising. There isn't a "scare campaign" that I can see, just predictions based on a scientific hypothesis, and observations that match those predictions. The problem with rising sea levels is that hundreds of millions of people will have to relocate, abandoning trillions of dollars of infrastructure. Solar power can be used with energy storage systems. Try reading some research on the areas you're discussing instead of spreading misinformation like your post does.
-
Re:Persective indeed
You might associate it with coral reefs, but the majority of it is far more bland.
Check out these articles on whale falls. It's pretty cool.
http://www.nurp.noaa.gov/Spotlight/Whales.htm
http://www.mbari.org/news/news_releases/2002/dec20_whalefall.html -
Re:Whatever
NOAA (who is the one responsible for most American earth observation satellites, not NASA, although I'd hardly expect the Slashdot editors to know that subtlety) has been releasing image data from the GOES satellites to the public for a while. "GOES" stands for "Geostationary Operational Environmental Satellite," so yes, they are in geostationary orbit.
-
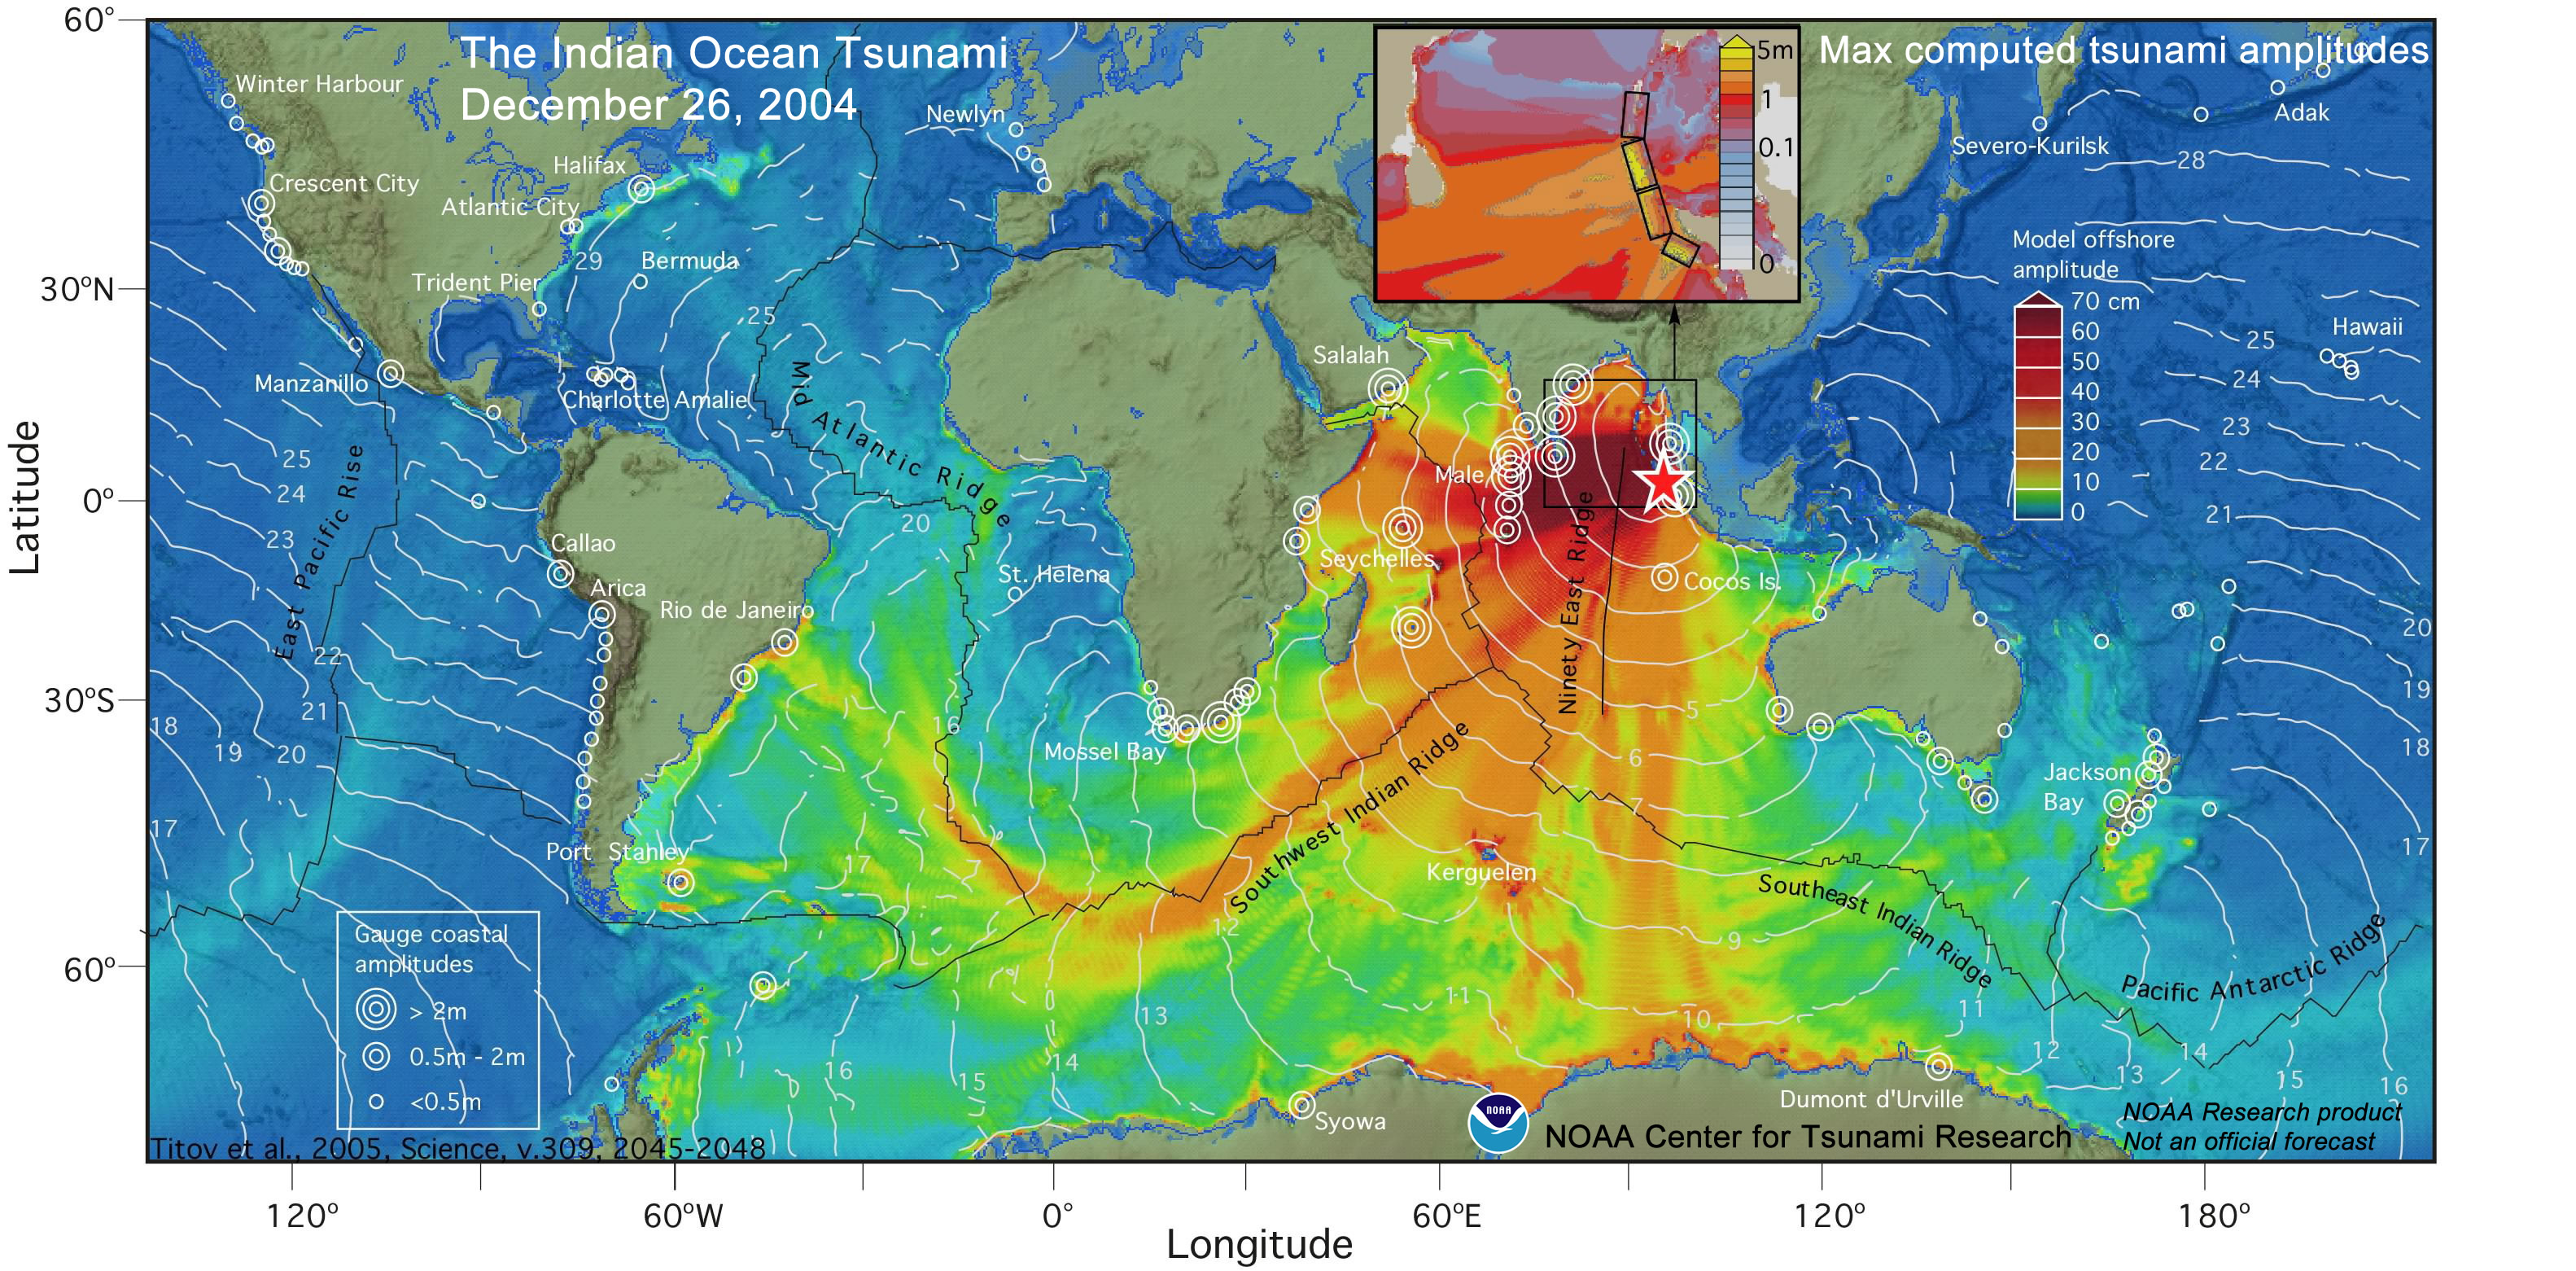
Re:9.0 Quake, Tsunami are what we need to fear
If New York City were hit by a 9.0 earthquake [...] Then if there's a Tsunami to follow, there could be another 10 million (at least) killed from that. Because DC, Baltimore, Phildelphia Newark, and Boston would also be affected. Tsunamis are frightfully destructive, but they don't turn sharp corners. Look at http://nctr.pmel.noaa.gov/indo20041226/Figure_1_sign.jpg. DC, Baltimore, Philadelphia, and Boston would all be fine, as the tsunami from a NYC earthquake would do little to water levels in the Chesapeake Bay and the Potomac (Cape Charles is in the way), the Delaware Bay and the Delaware River (Cape May is in the way), and the Massachusetts Bay (Cape Cod is in the way).
-
Re:How much offset?
Are you implying that it's windier, or that there are no cute secretaries in Chicago?
If the former, New York is actually as windy or windier than Chicago on average, though if the latter, I'll have to defer to your expertise.
-
Family Disaster Plan
Blatant karma whoring here...
Make a Family Disaster Plan, from the National Severe Storms Laboratory: http://www.nssl.noaa.gov/edu/safety/disasterplan.html
Note: plans described by this site cannot help you mediate disasters in your professional and personal lives.
-
Re:Thank goodness for NOAA
5.5 Billon isn't a pretty penny?
-
Re:Why do they even go at different speeds
Of course realizing something happened, computing predictions and distributing the information in a timely fashion is also non-trivial. I don't know exactly when they posted it, but there certainly wasn't much delay in getting predictions on the internet. The NOAA has some good information on their tsunami research program including information about today's event and a youtube video of the simulation
-
Re:8.9 Now, Tsunamis Ahead
Meanwhile for the US there are active tsunami warnings in Hawaii, and NOAA has just issued a watch for the US West Coast.
Yeah, right... the waves will stop exactly at the 49th parallel. idiot. the watch/warning is for the West Coast INCLUDING parts of Canada. Moron. If you're going to say something, at least be accurate so you don't kill people.