 Slashdot Mirror
Domain: ucar.edu
Stories and comments across the archive that link to ucar.edu.
Comments · 361
-
Re:Let's have some context, please
Looking at this NOAA graph it looks like it's been hotter since the 1990s. 1998 may not have been hot compared to other years in the 1990s, but it was hot compared to 1938. Looking at the graph, I can easily see how 2008 can be colder than every year since 2000, and yet hotter than every year in the 1980s.
Do you have a source for these temperature statistics you keep referring to? From the graphs I've seen, it does look like the Earth's temperature is increasing. Scientists even think it's likely that most of the warming is due to the carbon dioxide we're putting into the atmosphere from burning fossil fuels and forests.
-
Re:Cue the rationalists....
The last time that I checked the predictions weren't matching the observed temps. We weren't having anywhere near the "predicted" level of so called global warming.
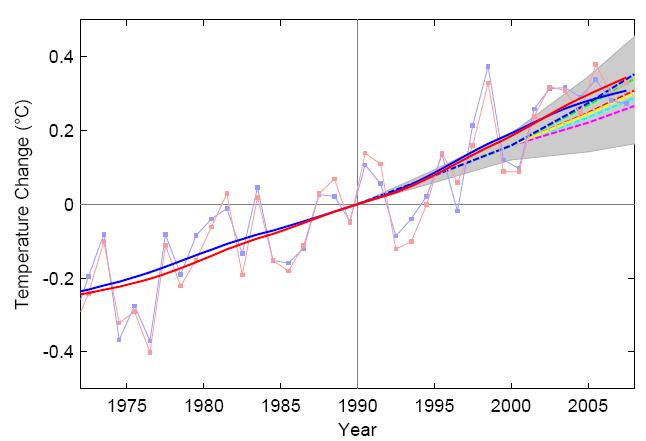
In point of fact, we are pretty close to the predicted level of global warming. Here is a comparison of the predictions made in the mid-1990s to the observations; solid lines are observations, dashed lines are models. This is from the Rahmstorf et al. paper last year in Science. They're a little off, but given the large year-to-year fluctuations in temperature and the high autocorrelation of those fluctuations, the uncertainty in the smoothed trend overlaps the uncertainty in the model projections (see the gray error bars); you can see that uncertainty for one model (GISS ModelE) here.
You need a much larger difference between observations and models to statistically conclude that there is a real discrepancy. As I said, this takes about 30 years; you can't conclude anything on the basis of 10 years. If current temperatures stay flat for another 10-15 years, we can start to say that there's a real discrepancy. Right now, we can't.
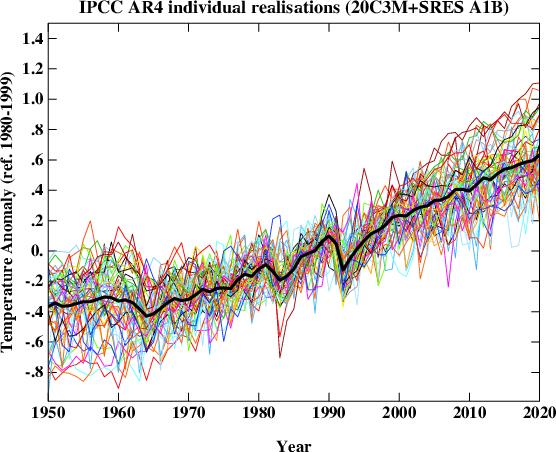
And if you look over more than the last 10 years, it becomes even more obvious that there is not some huge deviation between models and observations: see here (where the red line is the multi-model mean). This is from the IPCC AR4 report.
Note, for instance, that the deviation between models and observations in the 1940s is larger than the deviation today. But you don't see skeptics screaming that the 1940s disprove global warming. Maybe that's because (a) it's an example of where the climate temporarily warmed more than the models predicted, and (b) the discrepancy lasted about 10 years and then the models went back into closer agreement with observations. Discrepancies between models and observations on such short terms are statistically inevitable, and anybody who tells you that they always have to match up in perfect lock step is lying to you.
It's already in place today to speak out or voice any information against the entire global climate change thing will get you socially black listed and being called a long list of names to basically through out everything you've researched in order to keep their status quo.
Give me a break. GOOD science gets published. Hell, even BAD science gets published (looks at Schwartz's climate sensitivity estimate). You can find serious disputes in the literature about the effects on global warming on hurricanes, the magnitude of climate sensitivity, the trends in ocean heat content, etc. You are simply unable to tell the difference between a legitimate scientific critique and some armchair blog analysis. Case in point: "We weren't having anywhere near the `predicted' level of so called global warming."
It doesn't matter what the evidence says.
Maybe to people who have little knowledge of science.
-
Wheat price vs sun spots
A few hundred years ago William Herschel was able to notice the inverse relationship between sunspots and the price of wheat.
http://www.hao.ucar.edu/Public/education/bios/herschel.html
I find it amazing that this relationship (sun spots vs agricultural output) is dismissed so easily by the current anti-CO2 crowd. I am all for eliminating pollution but I am very worried that the focus on CO2 is completely wrong and is doing a great disservice to humanity.
CO2 is the breath of life.
_GP_ -
Re:Is biodiversity also booming?
-
Re:Read up on the Little Ice AgeThe Little Ice age only ended roughly 150 years ago, and we're still warming back up from it. To the contrary, 20th/21st century natural sources of warming (e.g., increased solar activity, decreased volcanism) do not agree with the recent warming in timing, rate, or magnitude. Temperatures in Europe are still several degrees C lower than they were pre-Little Ice Age (which started between 1350-1450). Provide a citation. This disagrees with the conclusions of the 2007 IPCC assessment report (WG1). There's plenty of evidence to support this from many universities and various environmental research groups. Then it should be easy to provide such evidence, shouldn't it? Why haven't you? If the predicted effects of an increase of 5 degrees C are so catastrophic, how come we weren't wiped out 1,000 years ago when temperatures ACTUALLY were where they're predicted to go? Temperatures 1000 years ago were not 5 C warmer than today. I had to do some research on the Little Ice Age a few years ago and every single source I found came back to the same thing, that we're still warming back up and that it's still significantly colder than it was 1,000 years ago. "Every single source"? You mean every skeptic website? Maybe you should look just slightly harder for a source that doesn't agree with your claims. Disclaimer: No, referencing research by various groups that contradict "the sky is falling" mentality of global warming is NOT flaimbait. Except you haven't even done that much: you referenced no actual research, just made a bunch of unsupported claims. But hey, we all know that preemptively invoking moderator persecution usually results in comments being modded up. No, we will most likely not have a huge catastrophe that destroys mankind. Who is claiming that we will have a huge catastrophe that "destroys mankind"? Perhaps you should read this about the likely impacts of climate change.
-
Re:Faster than light? No? Useless?Correct me if I'm wrong here, but communication with neutrinos would still NOT be faster than light, right? I'm sorry, but I don't think any galaxy-spanning civilization can possibly exist without FTL communication. Like, thousands of times FTL, because of the massive distances involved. According to one site the Milky Way is about 90,000 light years across. Which means it would take, let's see, 90,000 years (hard math, there) for a signal to cross the galaxy. Not exactly useful for galactic communications. This is also why I think projects like SETI@Home are ridiculously stupid. Even if other intelligent life did evolve elsewhere in the galaxy or universe, unless they evolved sooner than us (by at least the amount of time it would take for signals to travel from their world(s) ) their signals likely wouldn't have reached us yet. It's also possible that they evolved, developed RF technology, then either died out (and so stopped sending coherent signals), or moved on to FTL comms that we currently have no idea how to receive, or even the basic principles that they are based on (since we currently have no notion of any possible way for information to travel faster than the speed of light). Since we've only been receiving RF signals for about 100 years, the window of opportunity for other civilizations' RF signals to reach us during the period in which we were 'listening' is ridiculously small. Neutrino comms might be good for communicating inside of our Solar system, but unless they travel FTL, it would take a message a little over 4 years just to reach the next closest star to our Solar system. That seems pretty useless to me. Intersting Conjecture. I believe you are mistaking "Civilization" with "Government" When archeologists or ethnographers say "Civilization" they actually mean "Complex Society". In a complex society a single government only needs local control of one island. By exchanging smoke/neutrino/photon signals with nearby islands, they can exchange ideas. The exchange of ideas can create enough commonality between islands. Commonality is what makes us regard each other as part of the same "civilization" As long as we can exchange ideas, we can be part of the same complex society. We don't even have to be the same species. For one single government to control a "Civilization", its a good idea to have a reasonably short lag time. (Its why the ancient mediterranean and mesoamerican societies built so many roads.) But it's still possible to have a single government control a civilization if the periferal territories identify strongly with the central government. The ancient egyptions governed for over 3 millienia with a figurehead government consisting of a god-emporer, and local beurocrats empowered with the peoples loyalty. This is why they could work many generations to build pyramids. It might have lasted longer had they not buried the stargate
-
Re:Faster than light? No? Useless?According to one site the Milky Way is about 90,000 light years across. Which means it would take, let's see, 90,000 years (hard math, there) for a signal to cross the galaxy. Not exactly useful for galactic communications. Depends on how patient you are.
-
Faster than light? No? Useless?
Correct me if I'm wrong here, but communication with neutrinos would still NOT be faster than light, right? I'm sorry, but I don't think any galaxy-spanning civilization can possibly exist without FTL communication. Like, thousands of times FTL, because of the massive distances involved. According to one site the Milky Way is about 90,000 light years across. Which means it would take, let's see, 90,000 years (hard math, there) for a signal to cross the galaxy. Not exactly useful for galactic communications.
This is also why I think projects like SETI@Home are ridiculously stupid. Even if other intelligent life did evolve elsewhere in the galaxy or universe, unless they evolved sooner than us (by at least the amount of time it would take for signals to travel from their world(s) ) their signals likely wouldn't have reached us yet. It's also possible that they evolved, developed RF technology, then either died out (and so stopped sending coherent signals), or moved on to FTL comms that we currently have no idea how to receive, or even the basic principles that they are based on (since we currently have no notion of any possible way for information to travel faster than the speed of light).
Since we've only been receiving RF signals for about 100 years, the window of opportunity for other civilizations' RF signals to reach us during the period in which we were 'listening' is ridiculously small.
Neutrino comms might be good for communicating inside of our Solar system, but unless they travel FTL, it would take a message a little over 4 years just to reach the next closest star to our Solar system. That seems pretty useless to me. -
Re:mods?
Let's ignore that this was incredibly slow change. Let's pretend that tomorrow, we read in the news that Mars has warmed ten degrees in the last twenty years. Let's pretend that this isn't made less relevant by the fact that mars has an atmosphere with a small fraction of a percent as much thermal inertia as ours, and there's no even bigger oceanic thermal inertial source (the ocean) like we have on Earth. Let's pretend all of this was true for the sake of argument.
It Would Still Be Irrelevant As To The Causes Of Climate Change On Earth.
We have satellites, telescopes, and sensors monitoring every last thing you could possibly imagine about the sun. Unless the sun has some sort of magical powers, if the sun is changing in some way or another, *we'd know about it*. We don't need "planetary proxies" to tell us if the sun is getting brighter or whatnot; we have the hard data *right here*.
Oh, and for the idiots who just assume that the IPCC scientists forgot to consider the sun: there are about 50 peer reviewed papers summed up in the technical report (pretty much every recent peer-reviewed paper on the subject) related to the sun, changes in the sun, historical changes in the sun, how the various forms of solar radiation interact with earth processes, and so on. Now, how many of them have *you* read that lets you feel qualified to hold a contrary view? -
Re:One of those things is not like the others
http://www.mruzik.com/CO2.html
There is a study for you that contridicts the CO2 theory.Yeah, right. It's a pile of misleading statements to fool people who don't know any of the science. I think it's quite telling that you choose to cite a self-published web page which spends half its time deriding "left wing wackos", instead of citing any scientific studies. It's quite plain that your agenda is political in nature, not honest scientific skepticism.
Water vapor amplifies existing warming trends, but it cannot cause them; it is a feedback, not a forcing. You can't increase the average water vapor content of the atmosphere without first raising its temperature — otherwise, any excess water vapor would quickly precipitate back out. That's why you need forcings like long-lived greenhouse gases, solar irradiance, etc.
It's true that adding more CO2 to the atmosphere has less of an effect the more you add, because the adsorption bands start to saturate. This gives rise to the well known logarithmic relationship (Beer-Lambert law) between CO2 concentration and its radiative forcing. But it is nowhere near full saturation, which is why the curve is logarithmic rather than asymptotically constant. This is verified in laboratory experiments, in line-by-line radiative transfer codes, and IIRC in satellite observations of the atmosphere.
It is simply ridiculous to claim that CO2 causes cooling; it is at odds with both theory and observation. CO2 and warming exist in a feedback system: external influences (such as the orbital variations which set the timing for the ice age cycle) cause warming (or cooling), and CO2 amplifies that warming or cooling: warming brings more CO2 out of the oceans which leads to more warming; cooling has the opposite effect.
It is indeed quite possible that clouds contribute a negative feedback (cooling effect) in response to global warming, but that has nothing to do with the warming which is due to CO2. It just means that clouds may slow the warming beyond CO2's effect alone. There are a number of such feedbacks, both positive and negative. (Water vapor has already been mentioned as a positive feedback.) The instrumental temperature record indicates that the net feedback is significantly positive.
Let me know if you want any citations to journal articles regarding these topics. You can start with the latest IPCC report, Working Group 1.A fact is that there is no sound scientific data that climate change and CO2 correlate.
The very web page you cite notes the strong correlation between climate change and CO2 in the ice core record. (It goes on to claim, incorrectly, that the causation is backwards, but it admits the correlation.)
Indeed, all the studies are either inconclusive or say the opposite.
Oh really? What "studies" are those? Certainly none of the ones documented here.
Studies of icecaps indicate that before every iceage the earth's CO2 levels were much higher then at any time...
As I said, this doesn't mean that CO2 causes ice age. CO2 helps to warm out of ice ages, finishing what orbital variations and other climate forcings started. You can't get the large amount of warming observed in the ice age cycle if you ignore the greenhouse effect of the excess CO2. Eventually, the orbital cycle shifts into a phase of declining solar irradiance (well, it's more complicated than that; where the sunlight is concentrated and the extremes of variations contribute at least as much as the raw insolation itself), which causes temperatures to drop. A few centuries to a millennium after that, the CO2 starts dropping too, which hastens the cooling.
How many examples must I give you about statistics and how they can be misused before you will see the light?
Whee, statistics can be misused. So can mathematics, experiments, observations, and t
-
Re:Who Killed the Electric Car?
Yeah, we have sources. Mine was written by a large chunk of the world's climate scientists summarizing several thousand peer-reviewed papers. Yours is one guy going who thinks they're wrong. Same thing, really, right?
Let's check the quality of this great work of yours.
If you really want to irritate an AGW supporter, ask about the sun. To AGW supporters, only a Luddite would check the sun?s output when they could instead be obsessing over the increase in CO2 by 0.009% of the atmosphere. When they looked at the problem, the IPCC decided that over the last 50 years, the sun has been irrelevant to warming
BZZT, wrong! They did no such thing. The entire 106 page chapter 2 is titled, "Changes in Atmospheric Constituents and in Radiative Forcing". Most of the several hundred peer-reviewed references have to do with solar input reaching the Earth in one way or another. Around fifty to a hundred of them have to do with the sun itself.
Seeing yet why you should read this report before you debate? No? Then let's continue.
Note that the blue band in this chart (described in more detail in the last section), the IPCC thinks that without man, the world would have cooled over the last 50 years
That graph does not appear in the WG1 report on solar variability. They do, however, cite papers reconstructing solar variability through many completely different, independent means (Schatten and Orosz, 1990; Lean et al, 1992; Lean et al, 1992; Hoyt and Schatten, 1993; Lean et al, 1995; Solanki and Fligge, 1999; Lean, 2000; Foster, 2004; Y. Wang et al, 2005; Dziembowski, 2001). The results are all quite small -- an RF increase of 0 to 0.65 W/m^2 since the Maunder Minimum (the planet currently receives about 1300W/m^2). The older studies, especially the Lean ones, tend to be higher, and the newer studies lower. The report discusses how an underlying assumption of those studies was disproven, and the newer studies take that into account. If you want to learn more about any of those methods, the references are right there. They go on to explain the reasons with half a dozen more references.
But it turns out, interestingly, that solar irradiance may be close to its highest point in centuries. Al Gore says that current global temperatures are the highest they have been in 1000 years. A new study by the Institute of Astronomy in Zurich says that the "sun is more active now than it has been at anytime in the previous 1,000 years." Related?
*Included*. What, you think they just ignore studies they don't like? Sami Solanki, the author of the report linked, is even a contributor to the IPCC report. Amazing how they try to spin him as being part of their little denial group when he doesn't believe that at all.
We can look at solar output over large time frames by looking at the production of carbon-14 (less is produced in years of high solar activity, and vice versa). The analysis below used the ratio of oxygen isotopes in the stalagmites to estimate the water temperature at the time they were formed.
You're right -- you can! And so did the IPCC, which further makes obvious that the author of your page never even read the report. "An initial effort reported exceptionally high levels of solar activity in the last 70 years, relative to the preceeding 8,000 years (Solanki et al, 2004). In contrast, when differences in isotopes records are taken into account and the C14 record corrected for fossil burning, current levels of solar activity are found to be historically high, but not exceptionally so ( -
Re:Stealth Satellites?You note two articles backed up by folks wearing tin hats collecting public information and try to put forth the argument that what they were doing was somehow embarrassing super secret spy agencies. Riiight.
From a intel gathering perspective, if I were working for a foreign agency and I didn't have hard intel on the purposes of foreign satellites I'd start collecting by:
- Nte launch date any any publicly available information. Collect other information on satellites launched by NGOs and non-military organizations to note their characteristics and purposes.
- Note orbit characteristics (when, where, how often, orbit type, etc).
- Deduce purpose of the satellite.
Now suppose the manhours involved with steps 1 and 2 was 200,000 or whatever. These retards just save our opponents that effort. Now all they have to do is verify the information and decide which ones to knock out if they need to.
-
Re:Fantastic for Students and New Researchers
Some data is already available for students. The organization I work for (National Center for Atmospheric Research), has almost 8 TB of data freely available to anyone that isn't trying to make a profit off of it:
http://cdp.ucar.edu/home/home.htm
I imagine other public domain data is already available if you just know where to look. Google might help by providing a consistent interface, and more well known portal, but we've put a lot of effort into organizing and making available this data in its present form, and I doubt anyone is going to put in the time to move it to google's system. -
Re:In The Beginning Was The Command Line
Do you perhaps mean this one?
Mart -
No junk science
Actually, if you want to avoid the junk science and understand what real scientists trained in this field (not politicians, TV weather forecasters, sociologists and the other under-qualified catastrophic climate-change proponents) believe, the CGD Climate Research is a good source and is very relevant to this solar cycle post.
There are several coefficients they explain that are relevant to the earth's warming and cooling cycles. Also, be sure to read up on what real science has confirmed through ice core samples, helping us understand that CO2 lags, not leads, the warming cycles. As most peer reviewed studies have explained, you cannot have a cause-effect condition where A causes B when B follows A. This is called "correlation without causation" - yes, B and A are seen together a lot but causation cannot be established. It's like saying car accidents cause drunk driving because the two are so often found together. Most of the populist global warming information preys upon this intentional mix-up, either to further specific individuals research funding or provide a public stage. In a sense, you can't blame Al Gore too much - it's provided a hefty meal ticket and a peace prize for him.
But for those interested in objective science and getting to real answers about climate change (yes, there is lots of it!), solar cycles, earth orbit and axis tilt cycles, and cooling effects from exogenous events (asteroid impacts, supervolcano eruptions, etc.) have been demonstrated to provide overwhelmingly strong coefficients to climate variability and geologic change. -
Re:Carbon credits = lame
Tell you what: I'll show you lists of the authors and reviewers of the latest IPCC assessments, and you show me a list of the "several prominent meterologists" who disagree with them. My money is on the group that just won a Nobel Prize.
Here are the IPCC's working groups: The Physical Science Basis contributors and reviewers (see Annex II in that file); Impacts, Adaptation and Vulnerability contributors and reviewers; Mitigation of Climate Change contributors and reviewers. IPCC press information claims 800 contributing authors, 450 lead authors, and 2,500 scientific expert reviewers.
-
Re:We already have handheld supercomputers
No, really. An iPhone is much more powerful than the Cray-1, and probably significantly more powerful than a Cray X-MP.
I'm not sure why you believe this. I'll assume you mean the Cray 1A, since the Cray 1 is just a specification; it's a bit like talking about the 386, since the 386 ran at about a dozen different clock speeds. The Cray 1A was the first actual implementation of the Cray 1 spec, and was initially installed at Los Alamos. SCD's Cray 1 was installed about six months later, and ran at 160 megaflops. (The Los Alamos Lab one almost certainly ran at the same speed.)
Gen3 IPods use a pp5002d as a CPU. I'm not able to track down its actual performance, but in several places I see a Rio engineer saying that Vorbis is just at the edge of its performance capabilities. Tremor, a Vorbis implementation, runs just fine on the Nintendo DS - it eats about 40% of your CPU time if you're running it on the Arm9/75. Sony cites their UX50 - an Arm9/125 - as performing 2.51 megaflops. yCPUbench quotes 2.44, suggesting Sony has a slightly better tuned test set for that architecture, which isn't surprising. If tremor needs 40% of a 75mHz arm9, or ~30mHz, then it needs 24% of the UX50, or about 0.6 megaflops. This suggests that the iPod has a bit over 0.6 megaflops to bring to bear. Considering that all it does is play music, it should be no surprise that it has less CPU than a Nintendo DS, which needs to do many things in parallel with playing music.
What is surprising, however, is that you believe that it's faster than a Cray 1A. 160 to 0.6 - the cray from the 70s is approx. 265 times as fast.
Now, the Cray X-MP ran at a huge range of speeds, because it was a modular design; there are deployments that were several thousand times as fast as the base install. But, if you check that same SCD history PDF as above, their X-MP/48 ran at 0.91 gigaflops, or about one point five million times as fast as your iPod. Still, that was kind of a lower end X-MP, because SCD was saving up for a TMC CM-2. The X-MP is about half as powerful as an XBox running untuned linux. The iPod is nowhere near that ballpark; it's only about twice as fast as a Gameboy Advance.The iPhone certainly has much more RAM and storage than they typical early Crays
Storage, yes. RAM, not even close - your iPod has 96k, and in 1970, the Cray 1A at SCD hat 8 meg. Please stop making things up.
Maybe you should try doing the math before getting on the soapbox. When someone fills in the numbers you thought you could pull out of the air, and you're wrong by an average of six orders of magnitude, you start looking pretty bad. -
What the studies actually say
The current best estimate seems to be that aircraft emissions cause around twice the warming than you would get if the equivalent amount of CO2 was released at ground level, not including the affects of the resulting clouds (which probably makes it significantly worse).
http://ipcc-wg1.ucar.edu/wg1/Report/AR4WG1_Print_Ch02.pdf, as interpreted at http://www.tricoronagreen.com/tricorona/page.php?p=climateimpact
If so, I guess that invalidates the whole approach described in the article. -
Re:Gump - your a god-dammed genius
"Okay, so they've apparently voted again based on how much consensus there is in their opinion."
That is what is mean by the term "republic of science".
"Still no reference to any science."
That is because you are looking at the Summary for Policy Makers (SPM), the 2007 report is in three parts one unfinished, the other not yet on the web) - the science is in the technical report. But since you went to a bit of trouble writing that post I will do likewise - here is the pdf version of the SPM.
The SPM is intendend to summarize the science so politicians can make informed decisions, ie: The SPM is a peer-reviewed paper that is not cluttered with all that formal refrence notation. To track down the references got end of the glossary (p954) and you will find some references for the glossary itself (ie: they have defined their terms), on the next page is the start of a rather impressive list of contributors (ie: the authors) - the science is here - the contributors are people like Jim Hanssen who's published papers are relatively easy to find, some contributors have banded together here and will often answer specific questions ( such as the math and experiments you are looking for ). Finally on page 967 is the list of reviewers, who's credentials and publications are also "easy" to look up.
I'm sure if you dug around further you would find the workshop notes for the SPM's "working group" but that's where my patience runs out. I'm INAClimatologist but I do I have a "traditional" BSc in computer science with a major in operations research so I can understand (and argue for) the techniques used in building the models. It would be nice if we could just suck in any old subject but the truth is we can't so I (personally) choose to bow to the republic at this point and follow the high level arguments.
I have had an intrest in this since the early 80's when I worked on an old growth sawmill (greenies chained to dozers, ect), wasn't convinced that it "mattered" (even if it were true) until the 2001 IPCC reports, wasn't "alarmed" until the last few years when I realised it's not about wet feet, it's about dustbowls and famine. Not by itself mind you but combined with over fishing, peak oil, ect.
Fixing these problems would be a boom to both the economy and tecnology if nations could agree to some basic rationing of the "commons" based on our "best guess" as to what the biosphere can cope with, for C02 that figure is around 2.5GT/yr and IIRC we are currently 7.5GT over the limit. -
Re:So in other words..
And those were able to detect patterns as well, possesing the ultimate nanocomposite scientocrystalite ball:
Quote: "The next sunspot cycle will be 30-50% stronger than the last one and begin as much as a year late, according to a breakthrough forecast using a computer model of solar dynamics developed by scientists at the National Center for Atmospheric Research (NCAR)." (as of March 6, 2006)
CC. -
Re:whoa.
Just a couple of points. Our continuous upward trend, that scientific and news sources are giving out, do say that it's a recent trend. Recent meaning something like the last 30 years. I hope you seriously don't expect that to show in a 420000 year graph from ice core data? It takes time for the ice to form from falling snow for example.
There's still ice around, that's true. But I never heard that an interglacial would mean no ice anywhere. I think defining ice age to mean age when ice exists being a bad definition.
That wikipedia article is all nice and good, but if you want to read science about it, I recommend http://ipcc-wg1.ucar.edu/wg1/Report/AR4WG1_Print_FAQs.pdf as a starting point. Question 2.1 is particularly important because the radiative forcing graph is quite clear about humans being the deciding factor in changes in radiative forcing, that is the amount of heat arriving as radiation.
I'm certainly hoping that the existence of humans on this planet will come to be more than a blip!
-
Re:No crapMY question: how do we know that it isn't natural and cyclical? All the evidence certainly points to it... Really? "All" evidence? What is this evidence? It certainly contradicts the evidence summarized here.
There just isn't any evidence from past climate which indicates that a natural warming "cycle" like the one we're experiencing is due right now (see, e.g., here).
As for natural, non-cyclical warming, that's a harder issue. The short answer is that observations of both natural (solar effects, volcanoes, etc.) and human (greenhouse gases, atmospheric aerosols, etc.) sources of warming/cooling indicate that natural sources of warming can explain many warming events in the past, but strongly fail to account for the magnitude, timing, and rate of the warming trend over the last 30-40 years. On the other hand, inclusion of human sources can explain the observed warming pretty well. Both natural and human sources of climate change are necessary to explain observed trends, but natural sources alone appear unable to account for the recent warming that people are worried about.
You can read the above links for more information. I have a hard time believing that, in the hundreds of millions of years that those asteroids have been stirring around the sun since "the one" broke off and smacked into us, the belt itself didn't regain gravitational stability. I don't know what you mean by "gravitational stability". But as for your overall claim, you can actually run N-body simulations of asteroid belt dynamics and find that yes, the "hole" can indeed stick around for hundreds of millions of years. That is, in fact, what the authors of this study did. Now, you could argue that the simulations are incomplete in some way (and no doubt someone will), but you can't simply dismiss the evidence with a facile analogy to cookie dough. -
Re:Gap in asteroid tracking data -- Earth at risk?
Do we know this? I'm no astronomer, so I don't. Just how much can an orbit be altered by a collision? (Or at least, one that doesn't pulverize both objects).
I'm no astronomer either, but we can run some numbers found a la Google and give ourselves some reasonable estimates. Anybody who IS an astronomer is free to correct my numbers, but my intention is merely a "back of the napkin" class estimate.
How fast does an asteroid travel? The average speed of an asteroid is 25km/second. Since I'm am American, to me that's about 15 miles per SECOND.
Earth is 7,926 Miles across. For these figures I'll use 8,000 miles.
Asteroids are somewhere between 1.8 and 4.5 AU from the sun. The earth is 1 AU from the son. Since both orbit the sun, and the average distance of earth from the sun is 0 AU (orbit being roughly circular) let's say that the average distance of an asteroid from Earth is about 2.2 AU. Since earth is 1 AU and that is 93 Million miles, we'll say that the average asteroid is about 93 million * 2.2 miles from the Earth. That's 204.6 million miles from the Earth.
So let's assume that two rocks hit. What are the odds that the asteroid goes out and whacks the Earth, straight away? Well, we'd end up with a 204.6 MILLION MILE RADIUS on the inside of a very large sphere. Using the formula for calculating the surface of a sphere, we get 261,348,480,000,000,000 square miles of area that the asteroid could potentially hit. Compare that to the actual area of Earth to hit (a circle 2*pi*r) =~ 50,000 miles.
In short, you have a 50,000 in 261,348,480,000,000,000, or 1 in 5,226,969,600,000. (one in about 5 trillion)
These are very VERY VERY small odds, even if my back-of-the-napkin calculations are off by several orders of magnitude. Let's give you some idea just how BIG 5 trillion is. There have been about 1 billion seconds since Jan 1, 1972. To wait 1 trillion seconds is to wait about 30,000 years. If asteroids were to collide every SINGLE SECOND it would STILL take over 30,000 YEARS for one to hit the Earth directly.
Now, these figures are rough. They do not take into account orbital mechanics, etc. But even so, the numbers are very small (large as odds against?) indeed. -
Re:You mean like in Bioshock?
> Saline water freezes at about -1.8 C btw.
While seawater does indeed have a depressed freezing point, that in no way means that the ocean floor is below freezing. Maximum density is still at a temperature higher than 0C, and consequently the ocean temperatures are normally at 2-4C at the bottom. See http://www.windows.ucar.edu/tour/link=/earth/Water /temp.html&edu=high for a typical profile. Given that the Atlantic ocean is 3-4km deep, the temperature at the bottom ought to be no lower than 3C or so. So no, your freshwater piping will not freeze at the bottom of the ocean!
> Check this out...http://en.wikipedia.org/wiki/Antarctic_Botto m_Water
First of all, the article does not say just how cold that layer is (nor, ironically, how dense. WTF is 27?). In the absence of further data I'll assume it is still above zero. Second, it exists only next to the antarctic shelf, and it is safe to say that Rapture is nowhere near it. -
Re:The bigger issue
Right now, models predict that we would be cooling slightly, post 1950, without human influence. See Figure SPM.4 here.
-
Download climate data and models
Repost of my AC post:
Lots of data at NCDC.
Simple interactive Java climate model JCM5.
3D general circulation model EdGCM (based on NASA GISS Model II, state of the art in 1983 and what James Hansen himself used in his famous 1988 testimony to Congress).
For more modern and advanced models
There are a variety of Earth System Models of Intermediate Complexity (EMICs) which are not fully 3D models but represent a lot of physics and don't require a supercomputer. One such is UVic; there are many more (here).
You can even get full blown state of the art GCMs which run on supercomputers, like NASA GISS Model E or NCAR CCSM, but expect to run them for most of a year to get any kind of result -
Models
I've hit my 30 comment limit so I have to post anonymously, but:
Lots of data at NCDC.
Simple interactive Java climate model JCM5.
3D general circulation model EdGCM (based on NASA GISS Model II, state of the art in 1983 and what James Hansen himself used in his famous 1988 testimony to Congress).
For more modern and advanced models
There are a variety of Earth System Models of Intermediate Complexity (EMICs) which are not fully 3D models but represent a lot of physics and don't require a supercomputer. One such is UVic; there are many more (here).
You can even get full blown state of the art GCMs which run on supercomputers, like NASA GISS Model E or NCAR CCSM, but expect to run them for most of a year to get any kind of result -
Re:Question:I curious about a particular aspect of global warming: is the temperature increase constant? In other words, do nighttime temperatures rise the same amount as daytime and do winter temperatures rise as much as summer temperatures? According to the IPCC report (section 3.2.2.1, 3.2.2.7, diurnal temperature range), daytime and nighttime temperatures appear to have increased by the same amount in the warming since the 1970s. Warming appears to be slightly greater in winter than summer (FAQ 3.1).
-
Re:A solution to all of this FUD...> that as more and more analysts take a gander
And produce a report like, say, the upcoming IPCC synthesis report? Where lots of analysts "took a gander"?
Or just the selection of NOAA climate data that's free? Or, did you want to look at, for example, sea ice data?
Reallly, people. There's boats of data out there. Sure, it may not be in a "trusted" place (btw, who exactly would the contrarians consider trusted here?).
Have at it.
-
Re:Very biased article
Here you go... a fully opened source Community Atmosphere Model for you to play with.
The documentation and source code give detailed, unambiguous descriptions of the physics that go into such a complex model.
I recommend that you:
1. download the model
2. build the model
3. try a doubled CO2 run
I bet that your thoughts on global warming will change after going through this exercise. -
Re:Because the Surgeon General is a liberalLook it up and get educated. Don't just assume that a certain set of people who call themselves a "scientific consensus" (even though most of them are NOT scientists) are correct simply because they are "enlightened liberals." Anthropogenic global warming is about as correct as epicycles. The thing is, I have looked it up. I've read a number of primary source material. I've even has the chance to discuss the issues with at least two scientists (William Connolley, and Raymond Arritt -- I'm presuming the academic qualifications and long lists of publications will suffice to show they are indeed scientists) who work in the given field. Hell, I've even searched out a variety of published data and done my own (admittedly simplistic) analysis and graphs based on it: [1], [2], [3]. The result is that AGW appears to be a very well supported theory, while solar based explanations for the current warming (last 50 years or so) have proved to be quite insufficient. Perhaps you should actually go to some of the source material yourself. You can start with the most recent IPCC WGI report which provides a summary of a large number of papers -- all of which are sourced, so you can track them down for further detail on any particular points you are interested in. Finally, here are a couple of papers addressing your specific points that you might find interesting: on solar irradiance varation, and on cosmic rays.
-
Re:The problem with the sky is falling argument...I don't think it was ever quite as hysterical (for want of a better description) as the current global warming carry-on, but global cooling was being promoted by several apparently prominent people in much the same was that global warming is being promoted now. A new theory "being promoted by several apparently prominent people" is a far cry from "being promoted by the vast majority of the climate science community after decades of research", which is how global warming is being "promoted" now.
Despite the media scare, global cooling was never a widely accepted hypothesis, and those who proposed a new ice age cycle would start didn't claim that it was going to start in anything less than hundreds or thousands of years. Those who believed in global cooling via atmospheric pollutants also admitted that they didn't know enough about emissions to tell whether they would be outweighed by CO2 warming. (More here and here.)
This is in stark contrast to the current state of research of global warming, which has been studied intensively for more than 30 years and is now almost universally accepted within the climatological community (more here). -
Re:Just the opposite
Hear, Hear!
The article has it backwards. It's not the librarians job to learn how to serve millions of individual patrons (some of whom are research professors by now and will not tolerate this article's bull attitude to information accessibility, thank you very much). It's the individuals job to know how to look for information and ask questions. People who can't (or refuse) do this are consigned forever to be tourists to the land of real knowledge, with cheap phrasebook knowledge of the language spoken therein---to use the article's analogy. It's not their job to make you care about the topic at hand.
On a related note, try learning about the habits of those who actually DO know about technology: http://www.rap.ucar.edu/staff/tres/elements.html. This is just one of many examples of related phenomena, but I can attest. -
Bad science from CBC News
...the Cassini-Huygens spaceprobe made a descent over two years ago onto Titan, the only moon in the solar system known to have an atmosphere.
4 0.htm, or our own Moon's http://www.iac.es/galeria/mrk/atmo_lun.html or that of Enceladus http://www.space.com/scienceastronomy/enceladus_at mosphere_050316.html or Io's http://www.solarviews.com/eng/iomountain.htm, Europa's http://www.windows.ucar.edu/tour/link=/jupiter/moo ns/europa_atmosphere.html&edu=high, Ganymede's http://www2.jpl.nasa.gov/galileo/hst7.html, or Callisto's http://www.jpl.nasa.gov/releases/99/calliatm.html. -
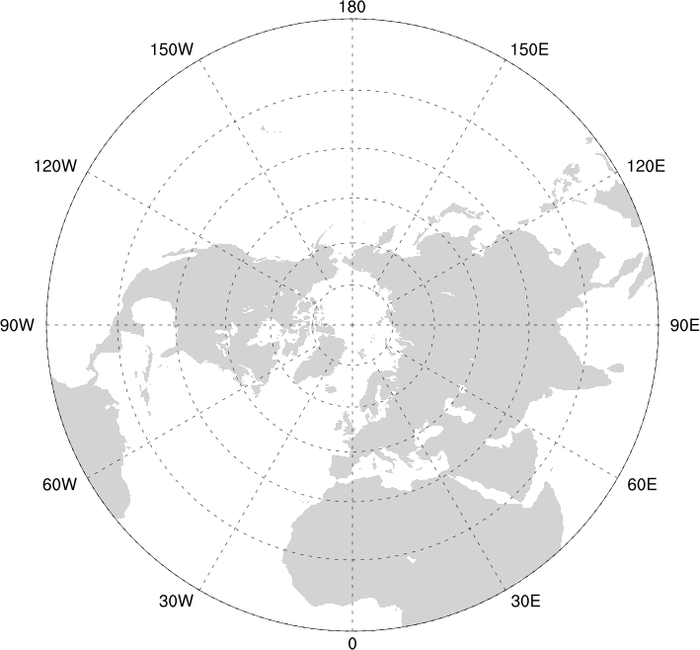
Geography knowledge of an AmericanI just looked at a polar projection map of the northern hemisphere, and it appears to me that the most direct path from the Middle East to the USA lies very near Poland. In fact, from what I can tell, to get any closer you'd have to put the missile defense system in Russia itself. Of course, it depends on which part of North America is your target.
Also, (and my measurements aren't exact here, I just used a Goldfish cracker to compare distances on the map) a missile base in Poland is about the same distance from North Korea as a missile base in central Alaska.
Similarly, a missile base in Poland is about the same distance from China as a missile base in central Alaska.
From what I've heard about Alaska, it would be far easier to construct and man a missile base in Poland than in Alaska.
If there is someone with more time on their hands and more appropriate measuring tools than a quick google images search and a Goldfish cracker, I'd be very interested in seeing actual measurements.
-
Re:How about some actual data?Now with extra previewing action:
The footnote says 1.5 to 4.5 degrees Celsius. That to me means wild ass guess.
There is a huge difference between "a scientific prediction with large uncertainty" and "a wild ass guess". A wild-assed guess is something that pulled out of thin air, with little study, no data or theory behind it. It's something that you wouldn't be surprised if the true outcome was far different from the "guess".
The IPCC prediction of [1.5, 4.5] degrees is quite different, since it is based on extensive study of many sources of data and of the detailed climate physics involved. It is unlikely that the true temperature will fall outside that range, and some of that uncertainty is not in what the climate will do, but in what we will do regarding our emissions.Models and data please!!
Geeze, read the damn report. To start, read the actual Working Group I scientific report, not the summary for policymakers. And try reading the most recent one, not the summary from six years ago. In other words, go here.
What do you expect me to take this on faith?
No, I expect you to go read some science. Sheesh.
I wish someone would give me mathematical models backed up by historical data instead of "fairly well established".
I already cited the IPCC report, which has links into pretty much all of the literature. If you want to go look up individual studies, knock yourself out. Just don't whine that everybody is hiding things from you. And tone down the paranoia. Do you actually think that the statements made by the IPCC are not based on mathematical models backed up by historical data?
Well let's see looked through it and it basically says that the temperature and the CO2 are rising over the last 300 years. Might as well be the decline in Pirates.
Ok, first, you're looking at a supplement to the IPCC report from 12 years ago, not the current report. And second, that's crap. It says far more than "temperature and CO2 are rising". If you read the full IPCC report, you will see numerous lines of evidence, which include but are not limited to:
1. Temperatures are rising.
2. CO2 levels are rising, within timing, rate, and magnitude comparable to what is needed to explain the temperature rise.
3. Other natural sources are NOT rising, or are rising by rates that disagree in timing, rate, or magnitude with the temperature rise.
4. Points 2 and 3 are backed up by detailed studies of climate physics and data sources which (a) determine the trends in the different possible causes of climate change and (b) determine the magnitude of temperature change which can be produced by each cause.
There is far more than a mere correlational link between temperature and CO2; there is a causal link by known physics, as well as a lack of causal link for other sources of warming (and in most cases, a lack of correlation as well).Well why not use the Vostok data?
Because you can't run global circulation models for hundreds of thousands of years (the length of ice age cycles); it takes a supercomputer to run them for hundreds of years. And even if you tried to run them for just during a glaciation, the main problem is that we don't know enough about the inputs to do that: we can put in CO2 levels, and a fair guess at solar levels as extrapolated from orbital dynamics, but there are many other contributors to climate. So you can't use the ice age cycle to constrain very well unknown parameters like the climate sensitivity to CO2 increases. Modern data tells you much more.
Oh I forgot it shows sharp and dramatic falls and increases in both CO2 and temperature (with CO2 slightly trailing temperature) which happen for no apparent reason.
Yeah dude, scientists don't know anything about the ice age cycle, but they know that it disproves global warming, so they'
-
Re:How about some actual data?
The footnote says 1.5 to 4.5 degrees Celsius. That to me means wild ass guess.
There is a huge difference between "a scientific prediction with large uncertainty" and "a wild ass guess". A wild-assed guess is something that pulled out of thin air, with little study, no data or theory behind it. It's something that you wouldn't be surprised if the true outcome was far different from the "guess".
The IPCC prediction of [1.5, 4.5] degrees is quite different, since it is based on extensive study of many sources of data and of the detailed climate physics involved. It is unlikely that the true temperature will fall outside that range, and some of that uncertainty is not in what the climate will do, but in what we will do regarding our emissions.Models and data please!!
Geeze, read the damn report. To start, read the actual Working Group I scientific report, not the summary for policymakers. And try reading the most recent one, not the summary from six years ago. In other words, go here.
What do you expect me to take this on faith?
No, I expect you to go read some science. Sheesh.
I wish someone would give me mathematical models backed up by historical data instead of "fairly well established".
I already cited the IPCC report, which has links into pretty much all of the literature. If you want to go look up individual studies, knock yourself out. Just don't whine that everybody is hiding things from you. And tone down the paranoia. Do you actually think that the statements made by the IPCC are not based on mathematical models backed up by historical data?Well let's see looked through it and it basically says that the temperature and the CO2 are rising over the last 300 years. Might as well be the decline in Pirates.
Ok, first, you're looking at a supplement to the IPCC report from 12 years ago, not the current report. And second, that's crap. It says far more than "temperature and CO2 are rising". If you read the full IPCC report, you will see numerous lines of evidence, which include but are not limited to:
1. Temperatures are rising.
2. CO2 levels are rising, within timing, rate, and magnitude comparable to what is needed to explain the temperature rise.
3. Other natural sources are NOT rising, or are rising by rates that disagree in timing, rate, or magnitude with the temperature rise.
4. Points 2 and 3 are backed up by detailed studies of climate physics and data sources which (a) determine the trends in the different possible causes of climate change and (b) determine the magnitude of temperature change which can be produced by each cause.
There is far more than a mere correlational link between temperature and CO2; there is a causal link by known physics, as well as a lack of causal link for other sources of warming (and in most cases, a lack of correlation as well).Well why not use the Vostok data?
Because you can't run global circulation models for hundreds of thousands of years (the length of ice age cycles); it takes a supercomputer to run them for hundreds of years. And even if you tried to run them for just during a glaciation, the main problem is that we don't know enough about the inputs to do that: we can put in CO2 levels, and a fair guess at solar levels as extrapolated from orbital dynamics, but there are many other contributors to climate. So you can't use the ice age cycle to constrain very well unknown parameters like the climate sensitivity to CO2 increases. Modern data tells you much more.
Oh I forgot it shows sharp and dramatic falls and increases in both CO2 and temperature (with CO2 slightly trailing temperature) which happen for no apparent reason.
Yeah dude, scientists don't know anything about the ice age cycle, but they know that it disproves global warming, so they're keeping it all hush-hush.
-
Re:BickeringThen perhaps you can tell me the figure, in W/m**2/ppm, that CO2 directly contributes to climate forcing...but I don't seem to be able to find a reliable source for it anywhere. It would seem you didn't look that hard. Current atmospheric carbon dioxide levels provide a radiative forcing of 1.66+/-0.17 W/m^2 (IPCC 4th Assessment Report, Working Group I, Summary for Policy Makers Figure SPM-2). Inferring from Figure SPM-1 it looks like atmospheric carbon dioxide provides approximately 0.02 W/m^2/ppm (though obviously there are threshold values involved). Feel free to dig through the details in the full WGI report.
-
Re:Nice find
A look at last year's paper listed in the article reveals they use the MM5 model. I doubt they switched from it in the time between that paper being submitted and the new one to come out next month.
-
Re:Oy vey gevault.
Dude. Where to start?
Ok, historically CO2 has been part of the feedback to solar forcing of climate change. But the increased CO2 has been a positive feedback, sustaining the climate change well past the solar forcing. What's different this time is that due to human activity we are pushing CO2 directly, so if our understanding of physics is correct (as established by Arrhenius himself), the result is heating. This is basic theory and the temperature record, though noisy, hardly contradicts this over the 20th century. Now, there's uncertainty about feedbacks, clouds, etc., but the CO2 forcing is there.
Do you see the spike? My eyeballs tell me the slope is roughly 100ppm/century.
Natural gross CO2 fluxes are huge. Net fluxes are small (i.e. they largely cancel out, and that's not accidental). Human fluxes are large compared to the net flux. See above link.
If you really don't think that CO2 traps heat, you are wrong. Grab a physics textbook, or start here. It has pictures and everything. -
Re:liquid core but little magnetism
You're reading it wrong. It is Mercury has quite a strong field compared to Mars or Venus.
Heres a short blurb which mentions that Mercury probably has a molten core written in 2003, http://www.windows.ucar.edu/tour/link=/mercury/Mag netosphere/magsphere_overview.html&edu=high -
Re:What do you know
Debunk this (sorry- PDF) and then we can discuss whether or not the debate about whether humans have a discernible impact on climate should be over. -
Really?Link from the link:
The main significance of the new data lies in the high correlation between GTG concentrations and temperature variations over 420,000 years and through four glacial cycles. However, because of the difficulty in precisely dating the air and water (ice) samples, it is still unknown whether GTG concentration increases precede and cause temperature increases, or vice versa--or whether they increase synchronously. It's also unknown how much of the historical temperature changes have been due to GTGs, and how much has been due to orbital forcing
-
Re:In the Jet Stream...
I don't think ice build-up would be a problem because this is so high any moisture's going to be solidly frozen already. Icing is a big problem when you're right at freezing so liquid or semiliquid water hits and freezes. When it's already solid, it usually just bounces.
here's a page with some discussion -- if you scroll down a bit there's a graph of dewpoint/temp/icing that indicates that under -15C you won't see any icing. When I got my pilot's license, what they taught was that the problem is entirely with supercooled liquid water, and "Generally, cloud ice and snow do not adhere to the airframe, and graupel and small hail may actually help to remove accreted ice." -
Re:Considering the "political" and environmental
"So will an increase in sunspot activity affect us?"
I'm not a climatologist, so take everything I say with a grain of salt. That said, I tend to doubt one slightly higher than average solar cycle maximum is going to have an noticeable effect on climate.
What's more interesting, to me, is the behavior over multiple cycles. For instance, a long-term disappearance of sunspots in the 17th century corresponded with the Little Ice Age:
http://www.ucar.edu/research/sun/climate.jsp
If you look at the cycles of the past century or so, the predicted cycle 24 peak isn't really all that impressive compared to those of the past 60 years.
http://www.nasa.gov/images/content/144063main_Pred ictionPlotLG.jpg
However, comparing cycles 12-16 to subsequent cycles is interesting. The sun does seem to have become more active in general. Has this had a global effect? More importantly, if there has been a global effect, is it detectable against local effects on climate? Keep in mind that even the Little Ice Age was largely regional.
Oblig. links:
http://www.sec.noaa.gov/Education/index.html
http://www.ucar.edu/research/sun/
http://spaceweather.com/
http://www.spacew.com/ -
Re:I'm gone
Before venturing out, research the planet.
I'll just wear a thick wooley jumpey when I go outside.
They don't call it a gas giant for nothing. The surface is less dense than water. You might be suprised by the distance you would sink into the surface.
Saturn's interior composition is primarily that of simple molecules such as hydrogen and helium, which are liquids under the high pressure environments found in the interiors of the outer planets, and not solids.
Quote blatenly stolen from;
http://www.windows.ucar.edu/tour/link=/saturn/plan et_structure.html -
Re:Huh, global warming
> (also note that seawater is densest a few degrees above freezing
> (~4 deg C, if I recall)
You are thinking of fresh water.
The density of seawater (e.g. with a salinity of 35) as a function of temperature increases with decreasing temperature (BTW, the article you linked to also mentions this
This graph (referenced by an article about arctic sea ice) shows that for seawater with a salinity greater than 24.7 the water freezes before it can get to the density maximum.
(The fact that sea ice floats seems to be related to density change due to phase transformation (sorry, no good source for that one)).
![[1]](https://en.wikipedia.org/wiki/Image:Temp-sunspot-co2.svg)
![[2]](https://en.wikipedia.org/wiki/Image:Sunspot-temperature-10000yr.svg)
![[3]](https://en.wikipedia.org/wiki/Image:Co2-temperature-plot.svg)