 Slashdot Mirror
Domain: usgs.gov
Stories and comments across the archive that link to usgs.gov.
Comments · 1,416
-
Re:Verification?
Just for the heck of it.
The USGS publishes automatic bulletins on the web of any quakes it picks up. It's all there for the viewing, if you wish. http://earthquake.usgs.gov/
Japan, which has a long history of big destructive quakes has the most thorough monitoring system in the world. If there was anything to be detected, they will have detected it. -
USGS has detected it
http://earthquake.usgs.gov/eqcenter/recenteqsww/Q
u akes/ustqab.php
Earthquake Details
Magnitude 4.2 (Light)
# Date-Time Monday, October 9, 2006 at 01:35:27 (UTC)
= Coordinated Universal Time
# Monday, October 9, 2006 at 10:35:27 AM
= local time at epicenter
Time of Earthquake in other Time Zones
Location 41.311N, 129.114E
Depth 0 km (~0 mile) set by location program
Region NORTH KOREA
Distances 70 km (45 miles) N of Kimchaek, North Korea
90 km (55 miles) SW of Chongjin, North Korea
180 km (110 miles) S of Yanji, Jilin, China
385 km (240 miles) NE of PYONGYANG, North Korea
Location Uncertainty horizontal +/- 14.9 km (9.3 miles); depth fixed by location program
Parameters Nst= 9, Nph= 9, Dmin=369.4 km, Rmss=1.13 sec, Gp= 97,
M-type=body magnitude (Mb), Version=6
Source USGS NEIC (WDCS-D)
Event ID ustqab -
Re:Sizemography
I wondered the same thing, but the historical activity (post-1990) in that area seems to be all off the coast in the Sea of Japan and not on the north Korean mainland. It's possible they meant "no airborne radiation", i.e. an underground test.
-
Re:Look at the seismic data. no spinning this one.
Unless I'm reading it incorrectly, the times don't seem to match.
The data recorded at Inchon shows an event on Sun 10/08/06 at about 14:30 UTC.
This site gives a time of Mon 10/09/06 at 01:35:27 UTC. -
Re:Look at the seismic data. no spinning this one.
Unless I'm reading it incorrectly, the times don't seem to match.
The data recorded at Inchon shows an event on Sun 10/08/06 at about 14:30 UTC.
This site gives a time of Mon 10/09/06 at 01:35:27 UTC. -
usgs map has updated
-
Re:Actually, USGS did detect seismic activity
Did this test really happen?
The USGS indicates a 4.2 magnitude event that occured at 01:35:27 UTC.
However, this event doesn't show up on any of the raw seismic data displayed on the live seismic server.
Pay particular attention to the Inchon, Korea and Matsushiro, Japan stations. Those stations seem to be reliable, and they're very quiet at 01:35 UTC. -
Re:Actually, USGS did detect seismic activity
Here's the quake info: http://earthquake.usgs.gov/eqcenter/recenteqsww/Q
u akes/ustqab.php
If you go to the Maps tab it gives you this Google Maps link (tinyURLized): http://tinyurl.com/ghvuy
Take a look about 4-5 miles north of the estimated epicenter, there's a large complex of buildings there. Wonder what those are? -
Mag 4.2
Here's the USGS link.
-
Re:Verification?
From the CNN Article:
However, South Korean intelligence officials said a seismic wave of magnitude-3.58 had been detected in North Hamkyung province, according to Yonhap.
They don't really have a lot of reasons to lie about it, and the US monitoring stations have picked it up. If this turns out to be false, I will be very much surprised. -
Look at the seismic data. no spinning this one.
You can see the Seismic Data here.
And a global map indicating it here.
No denying that one. -
Look at the seismic data. no spinning this one.
You can see the Seismic Data here.
And a global map indicating it here.
No denying that one. -
Re:Verification?
-
Actually, USGS did detect seismic activity
While the slashdot report says that the USGS didn't detect the test, actually the USGS site does show a magnitude 4.2 "quake" in North Korea at 01:35:27 UTC. The BBC reports the test as happening at essentially the same time (01:36 UTC).
USGS site: http://earthquake.usgs.gov/eqcenter/recenteqsww/Ma ps/10/125_40.php
BBC news report: http://news.bbc.co.uk/2/hi/asia-pacific/6032525.st m -
No unusual seismic activity
the USGS says that it has not detected any unusual seismic activity on the Korean peninsula in the last 48 hours.
I guess I don't know that this is unusual, but here's the seismic event in question:
http://earthquake.usgs.gov/eqcenter/recenteqsww/Qu akes/ustqab.php/ -
USGS
-
Sizemography
At this moment, US intel claims it "can't confirm" the event. However, US geologists apparently can. Transparency is a good thing, especially when it's not intended.
-
Re:Not Really the First
Mars Express may have had really great resolution, but unlike NASA, the ESA doesn't release raw images to the public from their spacecraft. They may do it in tidbits (I'm sure there's been one or two instances of it that I am not aware of), but not nearly on the same level as what NASA offers. I have tried, in the past, to contact the ESA regarding making full-resolution, raw images available. They said that they don't offer that sort of thing. Contrast this to something like the twin rovers, where it's easy to obtain full-resolution raw images in fairly short order. And if anyone has ever stumbled upon the big online archive of the Mars Global Surveyor images, they would be amazed at the sheer amount of raw image data that is available.
So, in conclusion, it's great and wonderful that ESA craft have imaging capability that is almost as good as NASA's, and I'm sure it's wonderful for all the scientists working in the field. But from the perspective of someone who enjoys looking at the raw data from various space missions (and is not a scientist), I am far more excited about NASA's projects. -
The effect is negligibleWhile technically you are correct, practically the effect is irrelevant.
In a paper titled "The Melting of Floating Ice will Raise the Ocean Level" submitted to Geophysical Journal International, Noerdlinger demonstrates that melt water from sea ice and floating ice shelves could add 2.6% more water to the ocean than the water displaced by the ice, or the equivalent of approximately 4 centimeters (1.57 inches) of sea-level rise.
So if all floating sea ice melted sea level would increase just 4 cm. In contrast, if the glaciers in Greenland melted (which you would think would have to happen if all floating sea ice melted), sea level would increase by an estimated 6.5 meters. Losing the Antarctic ice masses (which again would have to happen for all floating sea ice to melt) would increase sea levels by nearly 75 meters. The 4 cm contribution you point out is completely negligible except from an academic standpoint.
-
Corrected analogies
But we are far from having proved that human beings had any significant amount to do with it.
Sigh*. Once again, I'm struck by how people who frequent a nerd site can be so ignorant of what the science community says. Look, the climate science community has spoken on this subject in about as much unison as a bunch of cranky scientists ever get to: a substantial component of warming is due to anthropogenic carbon inputs (read any statements or reports from climate science organizations and this will be evident). If you've got substantial evidence to the contrary, please do publish it in a peer-reviewed journal immediately, as it is doubtless an important part of the scientific discussion. Otherwise please do us the favor of noting that your statements are discordant with 30+ years of scientific research.
I happen to think your UNIX analogy is a rather good one, but its present version relies on a critical faulty assumption, and that is that continue the current trajectory is "doing nothing". We are quite clearly not doing nothing, we are pushing a major lever of climate with increasing strength. The right way to analogize what we're doing is changing and deleting files from
You point out that Earth has done a good job moderating climate for millions of years. That's true, and it's due to a robust biosphere. As humans have grown to be the most populous macrofauna, we have dramatically changed a lot of those balances. In particular, since the industrial revolution our capacity to change those balances has grown dramatically, but our understanding and willingness to preserve them has moved much more slowly. Earth has never naturally produced hypoxic zones hundreds of kilometers across, nor has it dried out an ocean and filled it with chemical residues. These are unbalancing events due to changes to the environment not well integrated with the biosphere's functioning. That's not to say that sort of thing should never be done or can't be remediated, it's just to say that our ability to cause change in the environment around is now so great that we need to integrate better with the "legacy" functioning of the biosphere in our designs, or we're wreck the whole infrastructure. Throwing a nuke down a volcano is not a good example of this. Improving the natural capacity of algae to fix CO2 into cellulose and oils is a good example. Genetic modification of food is probably more in the middle - it's sometimes an effective enhancement to natural systems, and other times radically damaging. That's why I tend to be very skeptical of these geo-engineering projects that have very little component of restoring or enhancing biosphere functioning. -
Re:Hang on...
I worked at a colo provider that was a few miles from the San Andreas fault. Which is where it had to be — convenience to Silicon Valley was a big selling point. So they took lots of measures to make the facility survivable in case of a quake.
Earthquakes, tornados, floods, hurricanes — every location has a potential for disaster. It's stupid to pretend that you can find a place that's perfectly safe. Instead, you find one that reasonably safe, and do your best to anticipate the risks you can't eliminate.
-
Re:Not much, anymore...
"Six megapixels" and "high resolution" do not belong in the same sentence. If you had said a hundred megapixels, I might agree with you. Then you could have (400 megabytes) x (15 layers and masks) x (30 backups in the "Undo" stack)... I think you can eat memory (and then swap) very nicely under those circumstances, just for one image. (And no, a 400 megabyte raw image is not ridiculous -- try scanning a 6x7 cm transparency at 4000 dpi and see what happens!)
It was an accident. The computer eventually became conscious again. But I think it was 12000 dpi, and I think it was a larger file than that, in fact I think it barfed at the file size it was going to have to produce (2GB I'm guessing).
I really don't have a use for scanning anything at that resolution. I have a 3.2 megapixel Olympus camera which takes shots that are high resolution enough to produce a very good looking printed photograph which is a respectable size. I scan stuff like baseball cards, old photograph negatives, text and forms, model textures, things like that. To me, 3000x2000 is enormous. I realize I'm not a graphics guy or anything... but I probably do more than what I'd call an "average" user.
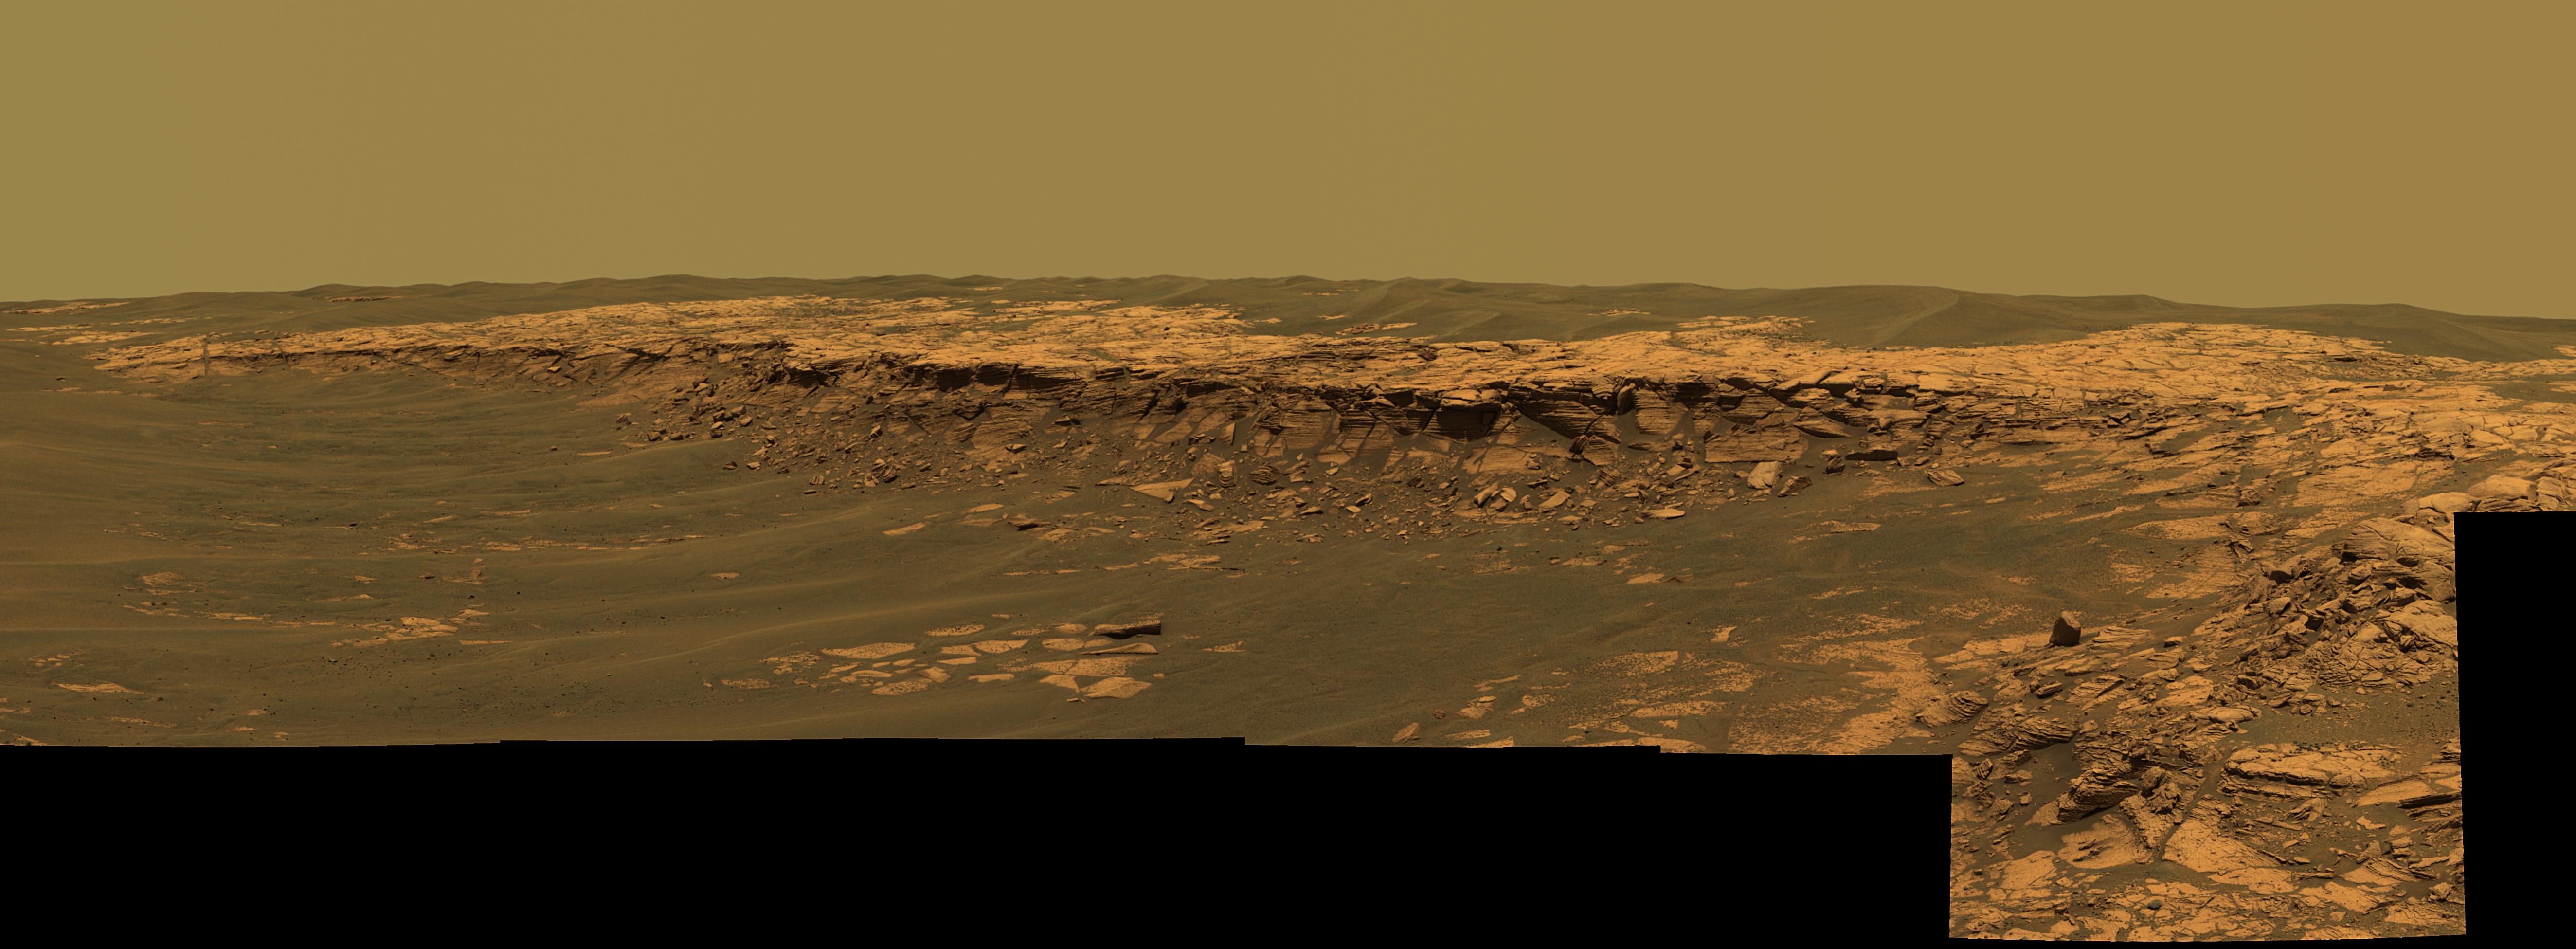
Here's a 10 megapixel photo of Mars.
Here's a 6 megapixel photo of the new lava dome inside of Mt. St. Helens.
Those are not "low" or "medium" resolution to me. -
Re:You can tell something about these people
Well, your numbers are slighly off (we'd get an order of magnitude more voltage, I think), but voltage is relatively unimportant. You can draw as much current as you like from this system. Even an appreciable number of watts won't really hold back the changing of the Earth's core, will it?
Once we get the current we need, then we can worry about stepping up the voltage as we need, or using the current to drive something non-electrical, or even building devices that use very little voltage and a lot of current. What if we use this current (low voltage) to charge a capacitor, then remove the capacitor and greatly decrease its capacitance (or connect it in parallel with a smaller capacitor)? We'd get a much higher voltage across the plates. Several things can be done with small voltage, so long as sufficient current is there.
The point is that the Earth's magnetic field, in changing, has a potential to do a lot of work, and the core is such a large system that we can do something useful, albeit not quite save the world, with the work it can capably do. (Steorn gave an example of never charging your cell phone and didn't mention anything about solving the peak oil crisis.)
As a similar example whose numbers are easier to manipulate, suppose we decided to draw 1 kW from the Earth's orbit. The Earth masses 6e24 kg and orbits at about 3e4 m/s, giving a kinetic energy of 2.6e33 J. Each year we'd only draw 3.1e10 J -- 23 orders of magnitude less. We would barely affect the orbit of the earth. And suppose we wanted to replace all the energy used by the world - according to the USGS, almost 4e17 BTU/year or 1.2e13 W. That would still give us a comfortable margin of 10 orders of magnitude. The point is that astronomical-scale systems won't significantly be affected if we tap human-scale energy out of them. -
Pluton? Damn namespace collision!
Pluton? Who the heck came up with that? Pluton already has a definition in geology where it is applied to blob-shaped masses of igneous rock that have solidified beneath the surface, such as typical granite intrusions.
And Ceres is going to become a planet? It messes up the traditional order of the long-recognized planets (e.g., Saturn is no longer the 7th planet from the Sun), and its composition is completely different from Pluto and its Kuiper Belt allies.
It's dumb. -
Re:Agricultural runoff
Actually, you have chosen the wrong river to illustrate your point. Human influences on sediment transport in the Mississippi River system have actually decreased markedly in the last half-century because of sediment storage in reservoirs constructed on the Missouri River in the 1950's and 1960's and because of other human modifications and influences. If you want to read more...
Commercially, the Mississippi is one of the world's most intensely regulated rivers. -
Re:Only solves 50% of the problem
Steel and aluminum are not equivalents.
Chemically, sure. In practical terms, however, they're both generally made with high-temperature smelters. And I think you missed my point: iron, steel, and aluminum, despite needing these high-temperature industrial processes, are all fairly cheap. They need energy, but that energy doesn't increase the price that much. And raw silicon metal? Less than a dollar per pound. ( http://minerals.usgs.gov/minerals/pubs/commodity/s ilicon/760397.pdf ) The cost of the silicon in a 120 watt solar cell is probably less than $20. (Evergreen's $600 model weighs 28 lbs. ( http://www.affordable-solar.com/evergreen.ec.120.g d.120.watt.cedar.solar.panel.htm )
So if it's not the raw metal, and clearly it isn't, what stage(s) of turning sand, etc. into a solar cell are expensive? *That's* what I'm trying to figure out. It doesn't seem you know specifically either; your (reasonable) point is generally "if it could be made cheaper, it would have already." And you may be right, I'd just like to know what in the process is the tough point or points. -
Re: Butterfly Effect
If they're doing this correctly, they aren't looking for individual points or even individual curves. They're (hopefully) trying to see the whole butterfly.
Any particular chaotic equation with a stable set of forcing constants will end up with a semi-predictable structure. The problem is that the weather's input forces are changing. Even so, you should be able to solve how those changes distort the overall shape, with sufficient computing power.
-
Re:Good news!
Actually that is kinda what happened in NZ recently - kinda funny, but also pertinant.
The core is that an earthquate happened in the alutians earlier this year in the night. The early warning system went off - some govt official here look at it and decided the risk was too low, and ignored it.
Somehow information about the earthquake and "possible" wave was picked up by overseas press and reported as roughly a "tsunami is heading for the east coast of NZ".
Overseas people began calling NZers they knew on the east coast telling them to run for the hills. The locals did (at about 5:30am), grabbing their neighbours and dogs.
In the end the govt official was right - there was no tsunami. Be nice if they told someone.
Anyway, point is that calling someone *did* work. People overseas called NZ and the word spread *fast*. I don't know whether it was fast enough to be useful, but there's something in there thats useful. Dont call people here - broadcast the news on the internet and news. *Someone* listening will know people in the affected area and the mass phone calls will start. -
Re:It's not a bad thing
Why? Just because a big tsunami hit recently doesn't mean the chances of it reoccuring are getting any smaller. A quick cursory search revealed this graphic that showed the amount of earthquakes > magnitude 5 per year is at least 1 all around the indian ocean. http://neic.usgs.gov/neis/density/eq_density.html
-
Re:Your Answer, Stephen
I suggest that the human race will survive the next 25 years or so by muddling along in its time honored traditions barring, of course, some unforseen global catastrophe.
Like this one?
http://exodus2006.com/supervol.html
It is being monitored very closely...
http://volcano.wr.usgs.gov/yvostatus.php -
Re:Warming
Contrarily, I've heard quite the opposite; that, in fact, human CO2 production is often undercounted and it in fact dwarfs the carbon dioxide spewed out by volcanoes.
For instance, http://www.fs.fed.us/gpnf/press/2001/pr284.htm
"Volcanologists estimate an annual global output of 200 million tons of volcanic CO2 per year
or
http://volcanoes.usgs.gov/Hazards/What/VolGas/volg as.html
"Scientists have calculated that volcanoes emit between about 130-230 million tonnes (145-255 million tons) of CO2 into the atmosphere every year (Gerlach, 1999, 1992). This estimate includes both subaerial and submarine volcanoes, about in equal amounts. Emissions of CO2 by human activities, including fossil fuel burning, cement production, and gas flaring, amount to about 22 billion tonnes per year (24 billion tons) [ ( Marland, et al., 1998) - The reference gives the amount of released carbon (C), rather than CO2.]. Human activities release more than 150 times the amount of CO2 emitted by volcanoes--the equivalent of nearly 17,000 additional volcanoes like Kilauea (Kilauea emits about 13.2 million tonnes/year)!"
(just a couple of sources after a brief search on google)
I don't know how accurate those sources are, so take it all with a grain of salt. Just don't blindly accept the axiom that volcanoes out perform humans in CO2 generation; it may not be true. -
Re:Not to minimize his work...
Another huge advantage of LED's over fluorescents:
LED manufacture uses far less dangerous chemicals. While LED's require small amounts of adulterants to manufacture (typically rare earth metals) All fluorescents use mercury vapor in small amounts to create light. If the old fluorescent bulbs are not handled / recycled correctly this mercury will get released to the environment.
Half of the mercury in the waters of the earth is from human activities.
Source: http://www.usgs.gov/themes/factsheet/146-00/ (USGS)
-
Re:Where does the lawn water go?
If that was actually the case, then no one in georgia would need to water their lawns. Unfortunately Georgia has been teetering on drought conditions (pdf warning) for years, and lawn watering actually is a big issue in a hot state like Georgia, because it doesn't soak right back down into the watershed, and it sure as hell doesn't replenish the aquifers. It evaporates. Poof. Gone. Georgia soil is mostly clay, and as you probably know, water doesn't travel through clay very well at all.
Georgia, btw, happens to be where I live. One of the main "crops" here is slash pine, which is what most paper is made from. TONS of papermills. Papermills use tons of water. They don't use crap water either, they pump the good stuff out of deep aquifers. We've got salt intrusion all down the damn coast, up into S. Carolina, and down into Florida. What does that mean? It means your magic well in a coastal county is full of salt, and the salt is moving inland. Why?
Ground water takes a while to replenish, and aquifers take, literally, centuries. When you pump water out of the ground, it doesn't come right back, and when it does come back, it moves in from the surrounding area and the ground water levels everywhere go down. That's the whole idea of a watershed, and there are 52 watersheds in georgia. Sounds like a lot doesn't it? Well there are 5 around atlanta, and they're all laughably overutilized. Pull that water out of the ground and dump it in a river, and some evaporates, and the rest of it flows on out to sea. Only the tiniest fraction of that water makes it back into the ground. So when you have low ground water on the coast, the ocean moves in to fill the lack.
A hundred years ago you could drill a hole in the ground, and you'd get a spring, water bubbling out on it's own. Now you drill a hole 5 times as deep, and put a big pump on it to get the same amount. We're running it down, and running it down quick, and, thanks to the attitude that we live in a land of inexaustable water, it's only getting worse.
I'm not that much of an environmentalist. I'm really not. But water is a big deal, a HUGE deal, and people who think that the supply is inexhaustable anywhere are living in a dreamworld. In the Southeast, it's a problem. In the midwest, it's a crisis, we're talking 10 years at best. It's no better in the west. We need a way to create cheap, clean water, and we need it BAD and we need it NOW. Failing that, we need people to stop blowing water on crap that doesn't matter. -
Re:Apples and oranges...Well, according to this US gov't report on titanium prices, titanium has never been cheaper, and consumption is generally up. I could find any market for titanium futures, BTW. Not COMEX, not FOREX, nothing. I wonder why that is?
--Rob
-
Re:Not continental drift
Using the lower number gives us a distance of 2850 kilometers in 50 million years.
You mean the lower number that is the relative speed between two plates that are moving away from each other?
Read what you posted again:
South America and Africa are moving apart at an average of 5.7 cm per year
The implication is that South America is moving 2.85 cm west each year and Africa is moving 2.85 cm east each year.
Since you are dealing with the absolute speed of a single plate (not its relative speed to another), you could "get away" with 2.85 cm per year.
However, since we are talking about either North American plate or the Eurasian plate, you should use 1.15 cm/year or 0.95 cm/year. This would be a worst case of around 600 km.
- Tony -
Re:the scale of things
The US has done pretty well with NOT radically cutting down forest, at least recently. We still have 75% of the forest land area as there was in the 1600's and forested area has been about constant at 300 million hectares since 1920 and nearly all the cutting down happened in the 19th century (note the first chart and the paragraph after "Characteristics of Forest Land" http://biology.usgs.gov/s+t/noframe/m1103.htm Of course someone can argue issues about whether tree farms that make up more of that area than years ago with a lower bio diversity are as good as natural forest, or produce as much 02 or remove as much CO2 and so on.
-
NASA 3D Flyover and links to USGS info and images
This isn't bad for a flyover prior to the current eruption: http://visibleearth.nasa.gov/view_rec.php?id=1549
, which should give you a sense of scale. Combine this with some of the images from the links below, and you'll have a much better sense of it. Visiting is of course best.
The model is from an earlier image series by NASA, prior to this building/eruption stage which started last late September/early October. The current fin is actually one of a series, with the first characterized as the whale back as I remember it, with each crumbling eventually, losing elevation, and another fin starting further to the West and South I believe. Details at the excellent USGS site for Helens and the eruption: http://vulcan.wr.usgs.gov/Volcanoes/Cascades/Curre ntActivity/current_updates.html
Also, the main page: http://vulcan.wr.usgs.gov/Volcanoes/MSH/Eruption04 /framework.html
Image pages (AMAZING shots, thermal images, etc): http://vulcan.wr.usgs.gov/Volcanoes/MSH/Images/MSH 04/framework.html. -
Re:Rebuilding
The mountain lost 1313 ft in its 1980 eruption. The article mentions the rock is rising 4-5 ft per day, and is 300 ft tall. It has 1003 ft to go
-
before and after pics
reading more into the eruption... found some cool before and after pics
Before:
http://vulcan.wr.usgs.gov/Imgs/Jpg/MSH/Images/MSH8 0_st_helens_from_johnston_ridge_05-17-80_med.jpg
After:
http://vulcan.wr.usgs.gov/Imgs/Jpg/MSH/Images/MSH8 0_st_helens_from_johnston_ridge_09-10-80_med.jpg
wow -
Re:Is that a rock in your pocket...."Or maybe it's that sexy mountain next door."
Maybe so."Northwest Indians told early explorers about the fiery Mount St. Helens. In fact, an Indian name for the mountain, Louwala-Clough, means "smoking mountain". According to one legend, the mountain was once a beautiful maiden, "Loowit". When two sons of the Great Spirit "Sahale" fell in love with her, she could not choose between them. The two braves, Wyeast and Klickitat fought over her, burying villages and forests in the process. Sahale was furious. He smote the three lovers and erected a mighty mountain peak where each fell. Because Loowit was beautiful, her mountain (Mount St. Helens) was a beautiful, symmetrical cone of dazzling white. Wyeast (Mount Hood) lifts his head in pride, but Klickitat (Mount Adams) wept to see the beautiful maiden wrapped in snow, so he bends his head as he gazes on St. Helens.
-- Excerpt from: U.S. Department of Agriculture, Gifford Pinchot National Forest "Mount St. Helens" Brochure, 1980 -
Re:I don't understand
I run an email service that sends earthquake notices. We can send out 50-60,000 notices about a big earthquake. That's gotten us blocked from some systems as a 'mass mailer' even though everyone on our list had to subscribe to get in.
-
It's a Glacial formation!
Hey that that kind of looks like the rocks here or here or here or here.
and check out these regularily "cut" bad boys here.
But how do you explain natural pyramids?
Oh I don't know maybe this quote:
"If the glacier erodes three or more cirques on different sides of the mountain, a peak will begin to form. The peak may be a steep pyramid shaped rock, which is known as a horn. The Matterhorn in the Swiss Alps is a well known horn."
Yah! -
Re:Wowwonder how this dinosaur fits into the standard archeological time-scale, age judged by the rocks around it etc
"The Snorre reserves lie in the fluvial sands of the Lunde formation from the late Triassic period and the Statfjord formation is early Jurassic."
http://www.offshore-technology.com/projects/snorre /Triassic: 248 - 213 million years ago
Jurassic: 213 - 145 million years ago
http://vulcan.wr.usgs.gov/Glossary/geo_time_scale. htmlDinosaurs first appeared in the Triassic and diversified greatly in the Jurassic. So yes, it fits. Nothing suprising here...
-
Re:Tip your bartenders and waitresses....
You conviently ignored explaining angular unconformities. I like angular uncomformities as a demonstration of old earth as you can walk right up to them and see them with your own eyes and there is little room for "interperation".
A flood very well explains marine deposits thousands of feet above sea level.
I can see that you are not up on the creationist literature. Creationist employ a mechanism called hydrological sorting to explain the sorting that is seen in the fossil record. For example why are no large modern mammal fossils found with dinosaur fossils. You are proposing the opposite of hyrdrological sorting where things are all mixed up and marine fossils are sitting on top of mountains. If that was the case then why not a single instance of a primate fossil in the same bed with a dinosaur? Also keep in mind many of these high elevation beds have signs of Bioturbation. These indications are present over many feet indicating that these organism where not buried and deposited but living in an slowly accumalating depositional zone.
You also ignored the fact that the Grand Canyon is layered with rock of different origins - limestone, sandstone, shale, igneous. How are these layed down by a single super flood. Some of these a layers are cross bedded sandstone, some are wind blown, some have raindrop marks, some have animal tracks and some have fossils.
More example of old earth? Magnetic reversals demonstrated on the spreading seafloor. Documenting long periods of time catching the reversal of the earths magnetic dipole as molten rock is layed down on the seafloor. Or how about ice core samples documenting seasonal transitions tens to several hundred thousands of years. Or large and thick geological deposits that consist primarily of tiny organism fossils such as diotomaceous chert, chalk and many limestones. Or layering of basalt with deposition in between. For example in which one of the these layers represents the global flood.
There sure is some willful denial going on here. I recommend you do some study and scratch in the earth yourself instead of just believing what supports your preconcieved notions and suppositions.
You are not worth debating this because you ignore the hard parts and spout off on tangents. For example you say For anyone to claim that such an event that from a physics standpoint probably cannot be measured or fathomed Are you saying that the flood existed outside of physics? Believe me if you look at the events that occur out in the cosmos such as supernova, solar flares, black holes, star collisions, planet collisions, a flood on a small planet is a tiny event by comparison.
It is you that shrinks God down to puny human size by having to believe in a creation story that a child can see as a fairy story a metaphor at best. Present day young earthers are akin to flat earthers or those who had to believe in geocentric earth. The concept of the earth rotating around the sun was at one time heresy. Good day. -
Re:Blowing Hot Air
You would be right not to believe that information, as it would seem that human activites C02 emissions were 150 times that of volcanic in 1998 and have been increasing ever since.
http://volcanoes.usgs.gov/Hazards/What/VolGas/volg as.html -
Volcanic contributions are a drop in the bucket.
From the USGS website:
Comparison of CO2 emissions from volcanoes vs. human activities. Scientists have calculated that volcanoes emit between about 130-230 million tonnes (145-255 million tons) of CO2 into the atmosphere every year (Gerlach, 1999, 1992). This estimate includes both subaerial and submarine volcanoes, about in equal amounts. Emissions of CO2 by human activities, including fossil fuel burning, cement production, and gas flaring, amount to about 22 billion tonnes per year (24 billion tons) [ ( Marland, et al., 1998) - The reference gives the amount of released carbon (C), rather than CO2.]. Human activities release more than 150 times the amount of CO2 emitted by volcanoes--the equivalent of nearly 17,000 additional volcanoes like Kilauea (Kilauea emits about 13.2 million tonnes/year)!
The contribution of volcanoes to global warming and cooling is very mixed. On the one hand, they spew small amounts of greenhouse gasses. On the other hand, they fill the air with particulates that result in solar dimming and global cooling. On the other hand, they add soot to snow which slightly affects it albedo and contributes to global warming. At any rate, the CO2 contribution of volcanoes is chump change compared to mankind's contribution.