 Slashdot Mirror
Domain: noaa.gov
Stories and comments across the archive that link to noaa.gov.
Comments · 2,602
-
Re:Get your forecast on your cell phone
Thanks! I was wondering why http://www.srh.noaa.gov/radar/ stopped working on my phone!
-
Weather is for geeks
I'm a meteorologist (or a meaty urologist - I can never remember). It's tough to believe there is any scientific discipline better suited for computer manipulation than the weather. For years, even before the advent of today's high speed computing, data was collected in a very systematic way, making it easier to compile and compare. Because I know there are so many reading this with the ability to advance the art, let me point you to a few data sources. Each of the files at this site contains all the world's weather observations for a since hour. Here's how to translate that. Here's forecast info from the GFS model, a time series for single points covering a full week's weather. Here's the same for the shorter range NAM model. The Weather Service even developed this free "Swiss Army Knife" program to read them called BUFKIT. BUFKIT has saved my sorry butt on more than one occasion. Here are MOS forecasts (dynamic model forecasts 'massaged' to take into account local climatology). The NWS is just scratching the surface, but it's getting better all the time. I look at my relationship with NWS as a partnership, not a competition.
-
Re:Impressive
They do. It's called RIDGE and they offer the radar in GIF format with an ASCII World File to make it work in GIS software. ESRI offers it's freeware ArcExplorer which you could probably user for this. I haven't tried it yet though.
http://www.srh.noaa.gov/ridge/ -
Updates in WML via WAP
Current conditions and forecasts are also available via WAP in WML format. This is the killer app IMHO: complete weather information on your phone.
(Requires browser that can handle WML.)
http://www.srh.noaa.gov/wml/wap_zc.php?zc=ann%20ar bor%2C%20mi -
No, you are incorrect
The earth hasn't really been steadily warming up for the last thousand years. What it did was suddenly and drastically warm up about ten thousand years ago. Since then it has been relatively steady in a single place.
Aside from this, the problem with global warming is that it does not represent the earth steadily warming up-- even if the earth had been steadily warming before human-caused global warming started. Instead, what we see is a decidedly non-steady, drastic, sudden, and accelerating trend in increasing temperatures right at the beginning of the industrial age.
We very well may be causing this, which would be bad, but what if we are not?
Then we're going to have to come up with entirely new models of how climate and atmosphere works, because the ones we have right now all say at the most basic level that if you drastically increase the amount of carbon dioxide in the atmosphere (and humanity has definitely done this) the climate changes.
Aside from this, think of it like this. Driving while drunk might kill you. However, what if it will not? Well, to what extent does the answer to this question matter? Because that's an outside chance at best.
Before you mod me down, remember, good scientists ask lots of questions, annoying questions.
Indeed, so in future if I were you I would stick to asking questions rather than randomly positing statements like "the earth has been steadily warming up for the last several thousand years" without finding backup for that. -
Re:Northern Hemisphere
Forget South America, the auroral oval never reaches Cape Horn's latitude:
Some images of the auroral oval from NOAA.
So, my suggestion is New Zealand for the Aurora Australis (of course antartic bases are ideal)
Anyway, if you visit souther Chile or Argentina in january or february you can see Noctilucent clouds. Southern noctilucent clouds are far less known than Northern noct. clouds... but also are very beautiful
Take a look at one:
Southern NLC, maybe the only picture on the net...
How do I know that? Well, I'm from here!
-
More info on Lost City
-
Re:Breaking News
I'm pretty sure there are some in Lower orbits too. Polar orbits are lower, some sats in the Polar orbits are NOAA/POES and DMSP weather satellites, Landsat and SPOT (remote-sensing satellites). See http://noaasis.noaa.gov/NOAASIS/ml/genlsatl.html for more info. There are not really "weather" (as we think of it) sats but gather data that is useful in many areas not just meterology.
-
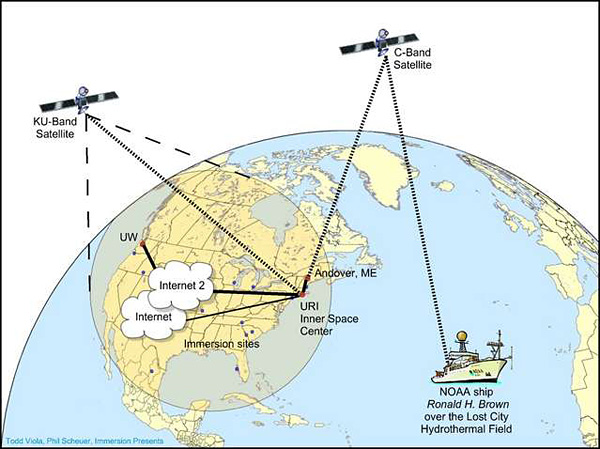
No direct link ROV Seattle
Am i the only one who first thought of a direct link between the ROV's and Seattle when reading the arcticle? What made me wonder: H2O doesnt let EM-waves go very far. Thus a ROV has a cable connection to it's mothership. But this draft should make it clear how it really is.
-
Codes are the tip of the iceberg!
I'm not going to assert very stringly that plain English WX might be useful, but the codes are not that obscure and are fairly easy to learn worldwide, even if you don't speak English or even use a Latin alphabet - and only the tip of what constitutes the offical definitions of weather observations codified in "FMH-1", the Bible of meteo observational arcana:
http://www.nws.noaa.gov/oso/oso1/oso12/fmh1/fmh1to c.htm
All helps ensure that weather descriptions are easy to read all round the world no matter what your native alphabet, or whether you are a machine or human.
And just think of the "legacy" code devoted to reading METARs! -
Other Eerie sounds
Here is a link to NOAA that has several soundclips of unidentified sea noises.
http://www.pmel.noaa.gov/vents/acoustics/sounds_my stery.html -
Sonar and Detecting Submarines
This array would likely be able to do it's share in submarine tracking, but only as piece of a larger system.
Part of the adventure of sonar detection is that low frequencies, especially the 30-100Hz range, travel thousands of miles with very little loss. This trick to long range submarine detection is listening for sounds from pumps, fans, etc, in those low ranges. Next, you need a wide baseline to triangulate a position. The SOSUS arrays covering the Greenland-Iceland-Britan gap covered hundreds of miles.
Now comes the problem of sound ducting. The temperature and salinity gradients of seawater can steer sound in much the same way as a mirage is from bent light due to temperature gradients in the air.
The Fata Morgana mirage, also called Looming, is a prime example of a sonar problem. By eye, you see a mirror image of a distant, even over-the-horizon object reflected as if by a mirror -- the temperature inversion layer. By ear, you care only for the direction of the sound, but now the problem is "which mirror?" As the sound curves up to the sea surface, it reflects back down, then curves up once again, and reflects again, at about 33 mile intervals. This is called a Convergence Zone.
These complexities go on and on, and require a wide range of sensors by depth and distance to detect and resolve the location of a sound source. The computers come in handy to do the filtering ID work, so you don't mistake a squid or a beluga for a Typhoon or Krasnodar... -
I don't think it's going to happen.
Tropical Storm Franklin is going to be in the way.
-
Re:Google's next move..
Actually, there already are some fairly extensive sources of imagery data available for the ocean floor:
http://www.ngdc.noaa.gov/mgg/announcements/announc e_predict.html -
like a common F0-F1 tornado here on earth
70mph is almost enough to push a mobile home off its foundation. I imagine it'll push a rover out of the way, or a dough-boy-looking human.
-
Re:More accurate readings
"The accuracy problem is caused by the US military screwing with the clocks."
That is called Selective Availability, and was removed about 5 years ago. See: REMOVAL OF GPS SELECTIVE AVAILABILITY -
Re:Wrong...Here's a reference, from NOAA's site. It's a
http://www.srh.noaa.gov/jan/hazards/HazardousWeath erProbabilities.doc
The relevant portion occurs at the end of the second paragraph:So, if we say there is an 80% chance of dense fog, this means that there is an 80% chance of dense fog occurring right at your location.
This seems to back up what I have heard and understood about the nature of the forecasts. However, I could be wrong. In fact, it is entirely possible that there are two systems being used, with no clear distinction as to which is being used in any given forecast. -
Re:The next logical step
Governments are put in place to do the things that private citizens and corporations can't do on their own: enforce order, build roads, provide for the common defense, etc.
Says who? You deftly slide this by as though it's a statement of fact. How about:Governments are put in place to do things that private citizens or corporations won't do, but that most private citizens wish somebody would do.
How about Governments are put in place to do whatever it is their electors mandate them to do? It should be pointed out, however, that this is the BBC and not the government, and although the degree of the BBCs independence is a slightly grey area, it is at least to some degree an independent corporation and one which is held in much higher esteem both in Britain and (I believe) in the world in general than the UK Government.
Furthermore, this is not simply the UK being more liberal with publicly funded 'intellectual property' than the US. For example, the digital forms of nautical charts are free from the US NOAA, but jealously protected by the UK Hydrographic Office. Both countries have inconsistent attitudes to the use of intellectual property produced at the public expense. As far as I'm concerned, if I've paid (through my taxes) to produce it, then I should have access to it for free, whether it's a recording of a Beethoven symphony or a chart of the North Atlantic.
-
Re:Hare Krishnas are not hippies
-
Re:Some more info...wider track
http://www.nhc.noaa.gov/refresh/graphics_at4+shtm
l -
Tracking Dennis
Dennis and Cindy information . I don't see why Dennis would interfere with Cape C. I think NASA is being over-cautious, as they have been for the past few years. Then again, I am obviously not a rocket scientist. Nor am I a meteorologist. Now I'm questioning why I am even making this post!
-
Re:"Bloop monster" evolves to phase 2
Here is the "Bloop" sound
http://www.pmel.noaa.gov/vents/acoustics/sounds/bl oop.html -
Bloop monster audio
Here's the roar of the fearsome beast...
Play this with caution!! I am still quaking with terror and afraid to go near the water. Be afraid, be very afraid... -
Re:More Photos Here, Plus Other Cryptid Catfish
Pound measures mass, not weight. An experienced river traveller can probably infer the mass correctly.
This is a dangerous assumption to be making. The truth is, the meaning of the pound is somewhat arbitrary still today. You can get different answers when talking to engineers vs physicists, for example. The pound is officially defined in terms of the kilogram, so you would think mass. But then you look at something such as PSI (pounds per square inch) which is a measure of pressure, being force per area, making pounds in that instance a force, and therefore a weight. You can read plenty about the ambiguity at http://en.wikipedia.org/wiki/Pound#Force.2C_weight
Another thing to consider is that mark twain did his most productive writing between ~1870-1890. The pound wasn't defined in the US in terms of the kilogram until 1893, according to the NGS at http://www.ngs.noaa.gov/PUBS_LIB/FedRegister/FRdoc 59-5442.pdf
I'm guessing that mark twain didn't have the grounding in physics to understand the difference between the two. Also, I'd be very interested to hear an explanation on how an experienced river traveler can infer the mass of an object that he saw underwater with anything even remotely better than a wild guess. Considering the crazy effects one can get from refraction, I'd say it would even be tough to give an accurate value for the LENGTH of the fish.
-
Re:Maybe, but maybe not?
Your memories are charming, but here's a nifty chart you can print out, fold, and tuck into your wallet so in future circumstances you are not limited to anecdotal evidence.
-
Who uses X-band?
REAL researchers use C-band. And 100KW of power! See my web page or the "official" web page.
-
The risk of ice falling has been reduced!
-
And let's not forget..
the foreign intelligence services and other spy types that are interested... oh and the Chinese Cyber Warriors... Oh - Organized crime is on the rampage such that the Feds miss old fashioned hackers. And Spammer botnets, and so on. Yep, way to blame those poor Stereotypical H4x0rz to get your name in the press yet again.
-
Re:Ambitious Maritius
How about a link to the map in question: Earth At Night.
And to those who question brightness as a valid measure of economic and social advancement, take a look at South vs North Korea. The difference is shocking.
(More info about this type of data is available from NASA, NOAA). -
More Info on Typial Wave Heights
Check out some data from the TOPEX mission with maps of the earth showing typical signifigant wave height here.
-
Doubly wrong post.You're wrong on two counts.
Since the 1700s, not a single earthquake in California that was over 6.5 has caused a tsunami there.
There have been 8 California quakes that have generated tsunamis. Though the San Andreas Fault isn't liable to generate a tsunami because it slips to the right instead of up/down, some California quakes are able to generate undersea landslides. Click on the image on this Mbari page and you'll see a substantial scar left by a landslide off the Santa Barbara Coast.
Secondly, yesterday's quake was north of Cape Mendocino which is at the southern end of a series of subduction faults that head up to Alaska. Unlike transform faults, subduction faults can, and do, cause tsunamis.
If anything, I think the media is ignoring some of the risks. Portions of Monterey Bay have very steep submarine walls. A 7.0 quake centered in the bay could generate a landslide that would send a tsunami towards the low-lying regions in Monterey and Carmel. The best advice for anyone in California who feels a quake while they're near the shore is to climb right away. Don't wait for the media to tell you there's a risk because the warning will come too late. Most of the time climbing will be unnecessary, but sometimes it'll save someone's life.
-
Solar Energetic ParticlesAll that I know I get from the others. (I do IT in a department full of solar physicists, but I don't fully undertand the data that I deal with)
NOAA maintains a list of 'Solar Proton Events'. My boss maintains a copy of the data, which has an extra footnote:The >10 MeV proton event began on January 16 at 0210 UTC following the X2.6 flare late on the 15th. The peak flux following this flare was 365 pfu at 16/1840 UTC. The >10 MeV protons decayed to 117 pfu by midday on January 17 when a stronger injection of protons occurred following the X3.8 flare and CME. This new infusion began at 17/1240 UTC and peaked with 5040 pfu at 17/1750 UTC. The event decayed to about 19 pfu early on January 20 when yet another proton flare occurred. The X7 flare and CME that occurred on January 20 produced the hardest and most energetic proton event of Cycle 23. The >10 MeV protons peaked at 1860 pfu at 20/0810 UTC. The >100 MeV protons peaked at 652 pfu at 20/0710 UTC, which was the highest >100 MeV proton flux level observed since 1989 October (680 pfu). The >10 MeV proton event finally ended at 22/1755 UTC.
So, the CME (believed to be) associated with it occured about 3 hrs before GOES got hit by it.
Images and movies of the event, as seen by LASCO, are at:ftp://ares.nrl.navy.mil/pub/lasco/halo/20050115b
-
Re:The new forecast is horrible and I hate it
If you fly (I fly power planes and gliders) the TV weather has *never* been adequate. Use the Met Office's web site instead, it's free and it has proper aviation weather (METAR/TAFs, rainfall radar etc.) Also, for gliding, look at NOAA's READY website (http://www.arl.noaa.gov/ready/cmet.html) which has soundings for the entire world (I find the Skew-T diagrams very useful for determining what kind of soaring day we'll have).
TV weather doesn't even tell you where the cloud bases are going to be or what the visibilities are forecast to be, and for sailing, I suspect Radio 4's Shipping Forecast is far more useful. -
Re:Solar Weather Data
The sources of realtime data mentioned in the post by Hoi Polloi are great - if you understand space weather and how to correctly interpret these data. I would guess that the average Slashdot reader does not. spaceweather.com and the main NOAA Space Environment Center are slightly better sources for a layperson. The Education and Outreach section of the Space Environment Center gives a good overview explaining what the geomagnetic indices actually mean. I'm always excited when we can see the aurora in the continental U.S., but I'm not quite sure I understand all the buzz about this geomagnetic storm. As far as I can tell, according to NOAA, this was only a G2 storm. This is a relatively minor event! It is near solar minimum, so geomagnetic storms of any magnitude are not very common right now and this was a special event in that sense. However, I don't remember seeing anything on Slashdot last November when similar levels of geomagnetic activity occurred. I have to admit I am a little perplexed by all of the sudden interest. Unfortunately all this sudden interest in space weather is a bit too late - NASA is probably going to cut funding for a lot of the programs that fund scientists who study the Earth's magnetosphere and space weather.
-
Solar Weather DataHere are some sources of realtime data:
-
Protons
See the second graph on this webpage for a graphical representation of the radiation levels. These are the events where radiation engineers on satellite programs find out if they did their job properly making their equipment hard against single event effects.
-
3-Hour K-Index Charts
I found an automatically generated graph here:
http://www.sec.noaa.gov/rt_plots/kp_3d.html -
Re:Funny I think...
They issued their alert on the 13th, this is just a nice PR piece. You can see this months alerts at http://www.sec.noaa.gov/alerts/archive/current_mo
n th.html. -
Re:Some other useful links
This one has a nice map of where auroral activity is taking place and shows relative intensity.
http://www.sec.noaa.gov/pmap/pmapN.html -
A Sunday Morning Report
Hell, it would have been nice to know this in advance...
As it was, got out of work about 0800Z Sunday morning and as I was driving home, thought I saw the most bizarre clouds. When I pulled into the driveway, there were these flashes that moved from west to east in the night sky. Since I live next to a small airfield, I assumed it was the lights from there, but when I looked in that direction, they were turned off. So, drove about 20 minutes west of the big city (damn that light) and was treated to a show that words cannot describe. This being my first aurora event, I had didn't know what to expect. I sat and watched for 45 minutes as the sky literally danced. About 30 minutes in, the aurora moved to right above my head and turned into a completely different show with different bands shooting out above me.
To anyone who hasn't witnessed an aurora, take the time to travel someplace that you can view them. It is totally worth the trip.
Judging by the POES Auroral Activity graphic, things are firing up again. Damn my luck that thundershowers are moving in to cloud things up.... -
Re:Applets? (OT)
I realize you're joking, however things like NOAA still use java applets for their radar loops...
-
Largest Cluster of RS satellites?
Perhaps I'm not understanding how the submitter is using the term "non-military", and not to wave Uncle Sam's flag too much, but offhand I can think of more than six US RS platforms/sensors:
EOS/Terra/MODIS http://modis.gsfc.nasa.gov/
Landsat ETM+ http://landsat.gsfc.nasa.gov/
Landsat MSS (yes still going)
AVHRR http://daac.gsfc.nasa.gov/data/dataset/AVHRR/
GOES http://www.goes.noaa.gov/
ASTER http://asterweb.jpl.nasa.gov/
Not to mention US based commercial satellites:
IKONOS http://www.spaceimaging.com/
Quickbird URL:http://www.digitalglobe.com/ -
Re:My own private army...
I've already paid for (with my taxes)
So how much are we paying?
According to the NOAA 2004 budget, 3.326 billion. And from what I can tell, they are making that 3B go pretty far. Assuming there are 300 million in the US, and all are paying takes (big assumption), that comes to $11 and change.
NOAA 2004 budget (9MB pdf) -
Re:My own private army...
What is at stake for AccuWeather, to me, appears clear. AccuWeather is a major consumer of NOAA/Natl. Weather Svc. data--as are most of the Weather forecasting boutiques--so the competitor is not NWS, the competitor is/are the people of the USA and other interested parties. AccuWeather, as a 'boutique', is paying for meteorologist and forecasters. NOAA's budget appropriations for NWS pays for most of the 'radars' and other advanced sensing equipment, e.g., satellite systems. NOAA's National Enviromental Satellite Data Information Service - (NESDIS) is the main guardian for US enviromental satellite systems and their data. I hope no one believes the 'hype' of these boutiques, they do not invest heaviliy in any of the infrastructure to perform the detailed environmental sensing used to attempt weather forecasting in the 21st century. Forcasting is more art than science, that is true, but even on a bad day, it is much more accurate than 50 yrs. ago (give me a break), certainly some may disagree tho' I can't see any basis for that opinion empirically. I can see no reason for AccuWeather's lobbying, except to become the middle man to public information.