 Slashdot Mirror
Domain: ourworldindata.org
Stories and comments across the archive that link to ourworldindata.org.
Comments · 84
-
Re:Solars dangerous too
Yeh, damn NIMBY's causing Fukushima with their pseudo-regulatory barriers. Solar's also dangerous! What if a solar panel fell and landed on a bird, it could chop the bird in two!...
NIMBY's kill birds!
Ok, let's look at the facts. Lets just start with the total deaths per energy produced. So even with the bad old nuclear designs from the 50s to 70s that we currently use are better than any other energy source. Even with that very few people want to build more BWR or RBMK's. Most scientists and engineers want to build MSRs but to build a nuclear plant you have to follow regulations that written for LWRs and BWRs. For instance, you have to have a Boron system in your nuclear plant by regulation. The Boron system is used to prevent water from splitting into H2 and O2 gasses in a high radiation environment. If too much gas builds up it explodes. So its a good regulation. Except MSRs don't use water for a coolant so there is no Boron system in an MSR. So technically, a MSR plant which can't meltdown and doesn't require external power isn't legal in the US. So an elected official(s) needs to change the regulations but nobody is willing to be the person who changes nuclear regulation due to the NIMBYs. So we have a design that we have been able to build for 60 years, can't meltdown and by any measure is far safer than the LWR and BWRs we are still building. Do you see any MSRs being built?
Consider this, have any of you ever seen an engineering situation where making something a political issue causes better decisions to be made? I doubt it, I never have and you probably haven't either. Making energy production a political issue is just the same as getting the VP of Marketing to choose which web framework you use. We've had a solution that works for decades and instead we delay and promise unicorns which never exist. Your arguments are largely out of ignorance. You probably know about your chosen profession but you clearly don't work in energy. You are expressing your largely uninformed opinions about a subject you haven't spent time researching deeply. And that causes you to believe things that just aren't so and often violate basic principles of physics. But energy production is about physics and physics alone and doesn't give a shit about what you wish was so. Perhaps it would be better to leave these topics to experts but as long as this is a political issue, I don't expect any progress.
-
Re:Yeah no fan of that
It depends how you slice it. In the West white guys are the biggest source of terrorism at the moment, always have been. This is especially true in the US. If you designate Islamic State as terrorists and consider everything they do as terrorism, you can make them the worst.
Who are these Marxists committing all these terrorist acts? Are we talking historically, before the internet existed?
Citations:
https://en.wikipedia.org/wiki/...
https://fullfact.org/crime/eth...
https://ourworldindata.org/ter... -
You're an idiot WindBourne, more came from USA
Individual carbon dioxide molecules have a short life time of around 5 years in the atmosphere. However, when they leave the atmosphere, they're simply swapping places with carbon dioxide in the ocean. The final amount of extra CO2 that remains in the atmosphere stays there on a time scale of centuries.
You're a bit thick so again, CO2 remains in the atmosphere a long time
This means that once in the atmosphere, carbon dioxide can continue to affect climate for thousands of years.
So it isn't just last years CO2 emissions that are warming Canada.
This is a much more appropriate timescale
If we extend our timeline back to 1750 and total up how much CO2 each country has emitted to date, we calculate each nation’s ‘cumulative emissions’.
If we fast-forward to the accumulated totals we see today, the US and Europe dominate in terms of cumulative emissions. China’s rapid growth in emissions over the last few decades now makes it the world’s second largest cumulative emitter, although it still comes in at less than 50% of the US total.
So in fact America is responsible for over twice as much CO2 as China.
But wait it gets better.The key drawback of measuring the total national emissions is that it takes no account of the nation's population size. China is currently the world’s largest emitter, but since it also has the largest population, all being equal we would expect this to be the case. To make a fair comparison of contributions, we have to therefore compare emissions in terms of CO2 emitted per person.
Let's just say, per person American's have been, and still are extremely bad.
Let's look here starting in 1950 to match the timescale in the summary and report. You can slide it yourself to see that the US is bright red on the map for every year and China barely breaks into the oranges. America's CO2 per person is over double China's even now. And don't forget you started at 16 tonnes when China was at less than 1.And all of that says nothing about how laughably inaccurate your 'climate modelling' is. Blaming China because of the wind patterns LOL. This is just you not even using the correct data.
You are a complete joke on this topic WindBourne. -
Re:where is all that CO2 over Canada coming from
Individual carbon dioxide molecules have a short life time of around 5 years in the atmosphere. However, when they leave the atmosphere, they're simply swapping places with carbon dioxide in the ocean. The final amount of extra CO2 that remains in the atmosphere stays there on a time scale of centuries.
You're a bit thick so again, CO2 remains in the atmosphere a long time
This means that once in the atmosphere, carbon dioxide can continue to affect climate for thousands of years.
So it isn't just last years CO2 emissions that are warming Canada.
This is a much more appropriate timescale
If we extend our timeline back to 1750 and total up how much CO2 each country has emitted to date, we calculate each nation’s ‘cumulative emissions’.
If we fast-forward to the accumulated totals we see today, the US and Europe dominate in terms of cumulative emissions. China’s rapid growth in emissions over the last few decades now makes it the world’s second largest cumulative emitter, although it still comes in at less than 50% of the US total.
So in fact America is responsible for over twice as much CO2 as China.
But wait it gets better.The key drawback of measuring the total national emissions is that it takes no account of the nation's population size. China is currently the world’s largest emitter, but since it also has the largest population, all being equal we would expect this to be the case. To make a fair comparison of contributions, we have to therefore compare emissions in terms of CO2 emitted per person.
Let's just say, per person American's have been, and still are extremely bad.
Let's look here starting in 1950 to match the timescale in the summary and report. You can slide it yourself to see that the US is bright red on the map for every year and China barely breaks into the oranges. America's CO2 per person is over double China's even now. And don't forget you started at 16 tonnes when China was at less than 1.And all of that says nothing about how laughably inaccurate your 'climate modelling' is. Blaming China because of the wind patterns LOL. This is just you not even using the correct data.
You are a complete joke on this topic WindBourne. -
You're an idiot WindBourne That's not how it works
Individual carbon dioxide molecules have a short life time of around 5 years in the atmosphere. However, when they leave the atmosphere, they're simply swapping places with carbon dioxide in the ocean. The final amount of extra CO2 that remains in the atmosphere stays there on a time scale of centuries.
You're a bit thick so again, CO2 remains in the atmosphere a long time
This means that once in the atmosphere, carbon dioxide can continue to affect climate for thousands of years.
So it isn't just last years CO2 emissions that are warming Canada.
This is a much more appropriate timescale
If we extend our timeline back to 1750 and total up how much CO2 each country has emitted to date, we calculate each nation’s ‘cumulative emissions’.
If we fast-forward to the accumulated totals we see today, the US and Europe dominate in terms of cumulative emissions. China’s rapid growth in emissions over the last few decades now makes it the world’s second largest cumulative emitter, although it still comes in at less than 50% of the US total.
So in fact America is responsible for over twice as much CO2 as China.
But wait it gets better.The key drawback of measuring the total national emissions is that it takes no account of the nation's population size. China is currently the world’s largest emitter, but since it also has the largest population, all being equal we would expect this to be the case. To make a fair comparison of contributions, we have to therefore compare emissions in terms of CO2 emitted per person.
Let's just say, per person American's have been, and still are extremely bad.
Let's look here starting in 1950 to match the timescale in the summary and report. You can slide it yourself to see that the US is bright red on the map for every year and China barely breaks into the oranges. America's CO2 per person is over double China's even now. And don't forget you started at 16 tonnes when China was at less than 1.And all of that says nothing about how laughably inaccurate your 'climate modelling' is. Blaming China because of the wind patterns LOL. This is just you not even using the correct data.
You are a complete joke on this topic WindBourne. -
Re:Been playing Horizon: Zero Dawn recently
It's one of those horrible things where no one wants it, but everyone seems to be forced to do it anyway. So, how to avoid it in the long-term?
We probably can't. But it's a very far leap from an autonomous drone or turret to an autonomous war machine. Guns need bullets, machines need fuel, until a Terminator-like AI takes control over the whole supply chain down to factories and refineries a rouge robot army would fizzle. As for humans thinking war would be winnable again, we still have ICBMs with nukes as the ultimate "fuck you too" with much better bang for the buck.
The best thing we could do is build the peace, no matter what the guys with the doomsday clock say I don't feel like we're anywhere near 1939-45 or 1962. Ethnic/racial tension isn't anywhere near the same in US or Europe or Japan as 50 years ago. Even Africa is fairly peaceful compared to the past, the Middle East is once more a cluster fuck but overall it's pretty quiet. From Washingon to Beijing it seems cash is king and capitalism doesn't care what your skin color is or where your parents come from or what's between your legs and how you use it.
Which is not to say it's your friend, but it's an equal opportunity exploiter. Mega-corporations don't need war, it's bad for business unless you're one of the few whose business is war. Sure, you'll probably have some more civil wars where shitty countries tear themselves apart. I think straight up invasions is going to be very rare though, unless it's some strategic grab like Crimea. Not that it's not a big deal but compared to the Soviet Union rolling in the tanks over half of Europe it's barely a nibble.
The reason I say it's inevitable is that this isn't a particular technology like ABC weapons. All the building blocks are generic and will be built even if they're not used to build kill bots at present it's not really a question of whether they'll be forced into service under duress. When your freedom is quite literally under fire, you're luck if they stick to the Geneva convention much less consider long term ramifications of militarizing this technology. If what you need to end the war is a nuke, you build nukes.
-
Re:Welcome to reality
I found some websites that have interesting info on poverty. The first one seems to suggest that around the year 2000 less than half the world was in poverty, but the graph stops just short of that. The second one says it plainly that after 2005 it dropped below 50%. I'm looking for more info, as you have to go by whatever their definition of poverty is. I did like the chart that showed dissatisfaction with living conditions, it showed that some "poor" people still had a pretty good life, while other poor folks had a really really bad life by their own measure. Cambodia, China and Bangladesh people were as satisfied or more satisfied than the survey in the USA. Naturally, you have to figure answering a survey isn't always accurate due to cultural norms about how acceptable it is to say your life sucks.
https://ourworldindata.org/ext...
-
Re:YouTube is banned in my house
Oh really? Maybe you should've spent 5 seconds to Google it before shooting off your mouth.
Maybe you should have done your research before shooting off your mouth. You do realize the chart you posted was a sliding scale right? It's adjusted for population. That red line look it's lower than other places it's been? Looks to me like 1890 was when the world had the fewest conflict deaths. That's not because 1890 had less people either.. it's a sliding scale.
There are 10 official wars and 8 active military conflicts recognized by the United States. There are also other violent conflicts involving 64 countries and 576 militias and separatist groups.
The four ongoing conflicts with the highest number of casualties (at least 10,000 deaths per year) are the Syrian Civil War, the civil war in South Sudan, the war in Afghanistan, and the Mexican Drug War. Those with more than 1,000 deaths include the Yemeni Civil War, the Somali Civil War, the Kurdish-Turkish conflict, conflicts in Nigeria, the war in Darfur, the Boko Haram insurgency, the Libyan crisis, the Sinai insurgency, the South Kordofan conflict. and the South Sudanese Civil War. Beyond this is the ever complex war with terrorists throughout the world like ISIL and Al-Qaeda.
Do those actual stats sound like a peaceful world, dipshit? We might not be having one giant global conflict, but we have a fuckton of small wars spread out all over the goddamn place. And just for reference, the Mexican Drug War is in reference to the cartels fighting the government of Mexico, it has nothing to do with the USA's War on Drugs.
-
Re:YouTube is banned in my house
Oh really? Maybe you should've spent 5 seconds to Google it before shooting off your mouth.
-
Re:"Geoengineering" is an idiotic substitute
Unfortunately 20% is next to nothing...
"Only greed and obstinacy prevent similar policies from working elsewhere in the developed world."
Check this graph to see what happened outside the developed world since the nineties:
https://ourworldindata.org/upl...
Now imagine we want to go back to pre-industrial levels. Good luck with hat...
-
Re:Is this a good thing or a bad thing?
That's why I qualified it. We don't know to what extent we can continue at this rate. I'm far more confident for photovoltaics than I am for wind.
Source: https://ourworldindata.org/ren...
You can download
You can see the module price (not including installation) has dropped from $66 / W to $0.62/W in 2016. That's a 100x decrease in price.
https://ourworldindata.org/gra...
The major cost now is installation. And that can only drop so far. -
Re:The rest of the original article
But US government-run healthcare will be different.
Totally off topic, but I was just discussing this elsewhere earlier today.......
-
Re:Are you sure haven't already reached 1.5C?
The woodfortrees site is an awesome resource.
The other one makes me very skeptical.
If temperatures are rising due to human CO2 production then, at earliest, the rise in temperatures should start at the beginning of the 20th C. The steam engine - the real cause for increased fossil fuel consumption wasn't developed until the end of the 18th C. If you're going to be particular about the phrasing - the first steam engine was developed in the late 17th C, but it wasn't until Watt's improvements, mainly the flywheel, that the steam engine came onto it's own. And, it wasn't until the early 19thC that high-pressure engines were developed.
Until this point - early 19thC - mechanized power, and the use of fossil fuels, was, for all practical purposes, the same as in classical times.
A graph on this site - https://ourworldindata.org/fos... - clearly shows that the rise of fossil fuel use (ie CO2 production) only really started by the beginning of the 20th C. And, since CO2 is the cause of global warming (according to AGW proponents), then any rise in temperature before the 20th C was not caused by fossil fuel consumption. -
World POP in 1800 was 1 billion not 70 million
. Why doesn't anyone actually think about the plausibility of their numbers before they go crazy with them ?
-
Re:Prohibition, MADD, War on Drugs, Columbine.
You know what the best way to reduce alcoholism is? Stress reduction and either a positive support network or mental health options.
See: https://ourworldindata.org/alc...
Compared to the 19thC we drink a lot less and have a lot less alchoholism. The figures for the 19th C because it averages out alcohol consumption over the entire population but there was a higher percentage of tea totalers. (The late 19th C, when we start having reliable statistics, had a strong prohibitionist movement.
And, if you look at the graphs you wont see binge drinking (a sign of alcoholism) or total annual consumption focused in countries with high stress jobs. -
If anything the world has gotten safer
At least with regard to natural disasters
https://ourworldindata.org/upl...
Oddly enough the 1910s were a pretty good decade for not dying from natural disaster, at a guess that might have been because people were too busy dying from WWI and the pandemic of the Spanish Flu
-
There is indeed a good reason
There's no good reason for the government to constantly exempt farmers from the normal law of supply and demand.
There is a reason, and it's a damn good one: To regulate supply and stabilize pricing.
Think about it: have you ever had to worry about food, really, really worry about it? A moderate price increase due to increasing oil prices at the turn of the century is the closest our country has ever come to a "food crisis". There has never been a serious food shortage or price inflation for food in the US for as long as I've been alive.
It used to not be that way. You can go back to the 70s, and read about how rapidly fluctuating food prices created quite a political stir, as evidenced by the April 1973 cover of Time Magazine. If you study the data on this page, you can see both how food prices (particularly beef) stabilized after 1980, and how the average worker has seen a steady increase over time in the amount of food that can be purchased with their wages.
That has been the primary purpose of the US Farm Bill: to encourage, subsidize, and regulate the food market, stabilizing pricing and providing ample food supply. Because when there's oversupply, people complain about food going to waste. When there's a lack of supply, people riot and governments collapse. Which would you really prefer?
-
Re:Land usage on planet Earth
Pastureland is the greatest use of land on Planet Earth. At some point, people will have to stop eating meat, whether you like it or not.
Only if we try to squeeze in 20 or 50 billion people on this planet despite all the other resource shortages we'd run into. Between 1950 and 1987 the world population doubled from 2.5 to 5 billion, if we had kept going like that we'd be at 10 billion in 5 years and 20 billion in 2060. At that rate we could kill all the livestock and the human biomass would eclipse it in 60 years. For all the people worried about global warming you can look at this curve and you'll see total emissions explode from 1950 and going forwards. We got room for cars and cattle and whatnot, but not for endless billions of people. An incel in a gas guzzler with a love for BBQ is doing far more for the environment than an vegetarian eco-hippie with five kids, because he'll die out while the hippie's kids will each have five kids who'll each have five kids and in less than a century you'll spend more land on lettuce than you ever did on beef.
-
Yeah maybe they keep hearing
How we have been killing the planet and how it triggers more and more disasters that will kill us all off
https://ourworldindata.org/wp-... -
Re:"The deaths of so many people"
According to the WHO and Japanese gouvernment, the direct death toll of the Fukushima disaster was: Zero. https://ourworldindata.org/wha...
The indirect results from radiation related issues and evacuation stress was not zero, but I find it hard to argue that the executives are directly responsible for the deaths of so many people. The tsunami itself caused tremendous devastation and evacuation was a given, with or without the nuclear plant there.
Don't even wonder why the general citizenry doesn't trust the pro-nuc clan. You are the personification of why.
Do a little research as to exactly why there was no other outcome but catastrophic failure for the Fukushima site.
All human decisions that from a safety, standpoint are inexplicable outside of straightforward explanation that there was corruption involved.
The GP did provide a link which backed up his assertions. You provided insults. Just saying...
-
Re:"The deaths of so many people"
According to the WHO and Japanese gouvernment, the direct death toll of the Fukushima disaster was: Zero. https://ourworldindata.org/wha...
The indirect results from radiation related issues and evacuation stress was not zero, but I find it hard to argue that the executives are directly responsible for the deaths of so many people. The tsunami itself caused tremendous devastation and evacuation was a given, with or without the nuclear plant there.
Don't even wonder why the general citizenry doesn't trust the pro-nuc clan. You are the personification of why.
Do a little research as to exactly why there was no other outcome but catastrophic failure for the Fukushima site.
All human decisions that from a safety, standpoint are inexplicable outside of straightforward explanation that there was corruption involved.
-
"The deaths of so many people"
According to the WHO and Japanese gouvernment, the direct death toll of the Fukushima disaster was: Zero.
https://ourworldindata.org/wha...The indirect results from radiation related issues and evacuation stress was not zero, but I find it hard to argue that the executives are directly responsible for the deaths of so many people. The tsunami itself caused tremendous devastation and evacuation was a given, with or without the nuclear plant there.
-
Negativity bias much? How about the good news?
There's an interesting quirk in human psychology that makes negative facts and news seem more salient than positive ones. For media that thrives on reader attention (and that's both new and old media), this naturally leads to more emphasis on the negative.
I think this is a bias worth noting and pushing back on. The world is pretty far from perfect, but there's also huge helpings of good news all around us.
- Continuing the trend, nearly 70M people in dire poverty gain access to electricity
- Extreme global poverty continues its decline, although it's getting harder to make progress on that front
- The US death rate from cancer continues its steady yearly drop. Cumulatively, this has prevented hundreds of thousands of deaths
- The pack of criminals who made a wholesale business of taking sex slaves in war lost their last city
- The world continues its steady march towards universal literacy. You can't embed pictures in
- The Long Peace continues for another year, meaning millions of lives impacted
- Cigarette smoking, a leading cause of totally preventable death, fell to its lowest rate in the US
- Automobile deaths per vehicle mile continued to drop
Most of these (Daesh not withstanding, but threw them in just because they were really vile) follow the same pattern: slow but steady progress. It's hardly clickbait -- in fact these are not even specific events you can point to, they are trends seen on the scale of decades. And on the scale of decades, the world is consistently becoming a less-bad place.
-
Another report from the U.N.
Seeing as deaths from air pollution have been falling for the last 30 years
https://ourworldindata.org/air...
And even China's falling, it seems this is another case of an activist looking for a cause.
Bringing up Tobacco seems rather odd as well especially since there now seems to be a war on vaping heating up.
-
Re: it's not clear.
That's not missing the point, it's exactly the point - the older you get the more you're playing the probability game, which is exactly what was said. What's really important is that the increase in cancer rates is NOT due to people getting older. Cancer rates are increasing for 15-49, 50-69, and 70+ age ranges. Also, rates are increasing for some cancers and decreasing for others. There's even something called age-standardization, to account for increased disease rates in an aging population.
-
Re: 8%
https://ourworldindata.org/co2...
According to the graph Emissions by source, we exhale today as much as we burned in 1950 by all our machinery combined.
-
Re:Glad I don't have kids
Population growth peaked around 1960: https://ourworldindata.org/world-population-growth
Solar and wind power are getting cheaper and more abundant than oil and most anything else.
We're probably going to be able to harness fusion power within 10-20 years, so could get access to safe, abundant and clean energy.
What are we going to do about it??
The solution IS the following: Not doing anything about it is going to cost much more damage than starting to do something about it. Once we get the ball rolling, it'll fuel entirely new types of economies.
-
200-350 billion per year by 2030
https://ourworldindata.org/how...
If we aggressively pursue all of the low-cost abatement opportunities currently available, the total global economic cost would be â200-350 billion per year by 2030. This is less than one percent of the forecasted global GDP in 2030.
That is according to goals of Paris agreement.
From the other hand, damage from global climate change is predicted to be
https://www.independent.co.uk/...As a result, the worldâ(TM)s gross domestic product would fall by $21 trillion by 2050, compared to $33 trillion under a âbusiness-as-usualâ(TM) approach that allows global warming of 2.5 degrees. This saving of $12 trillion (about £9.6 trillion) represents about 10 per cent of global GDP.
-
Re:Yeah, sure it can
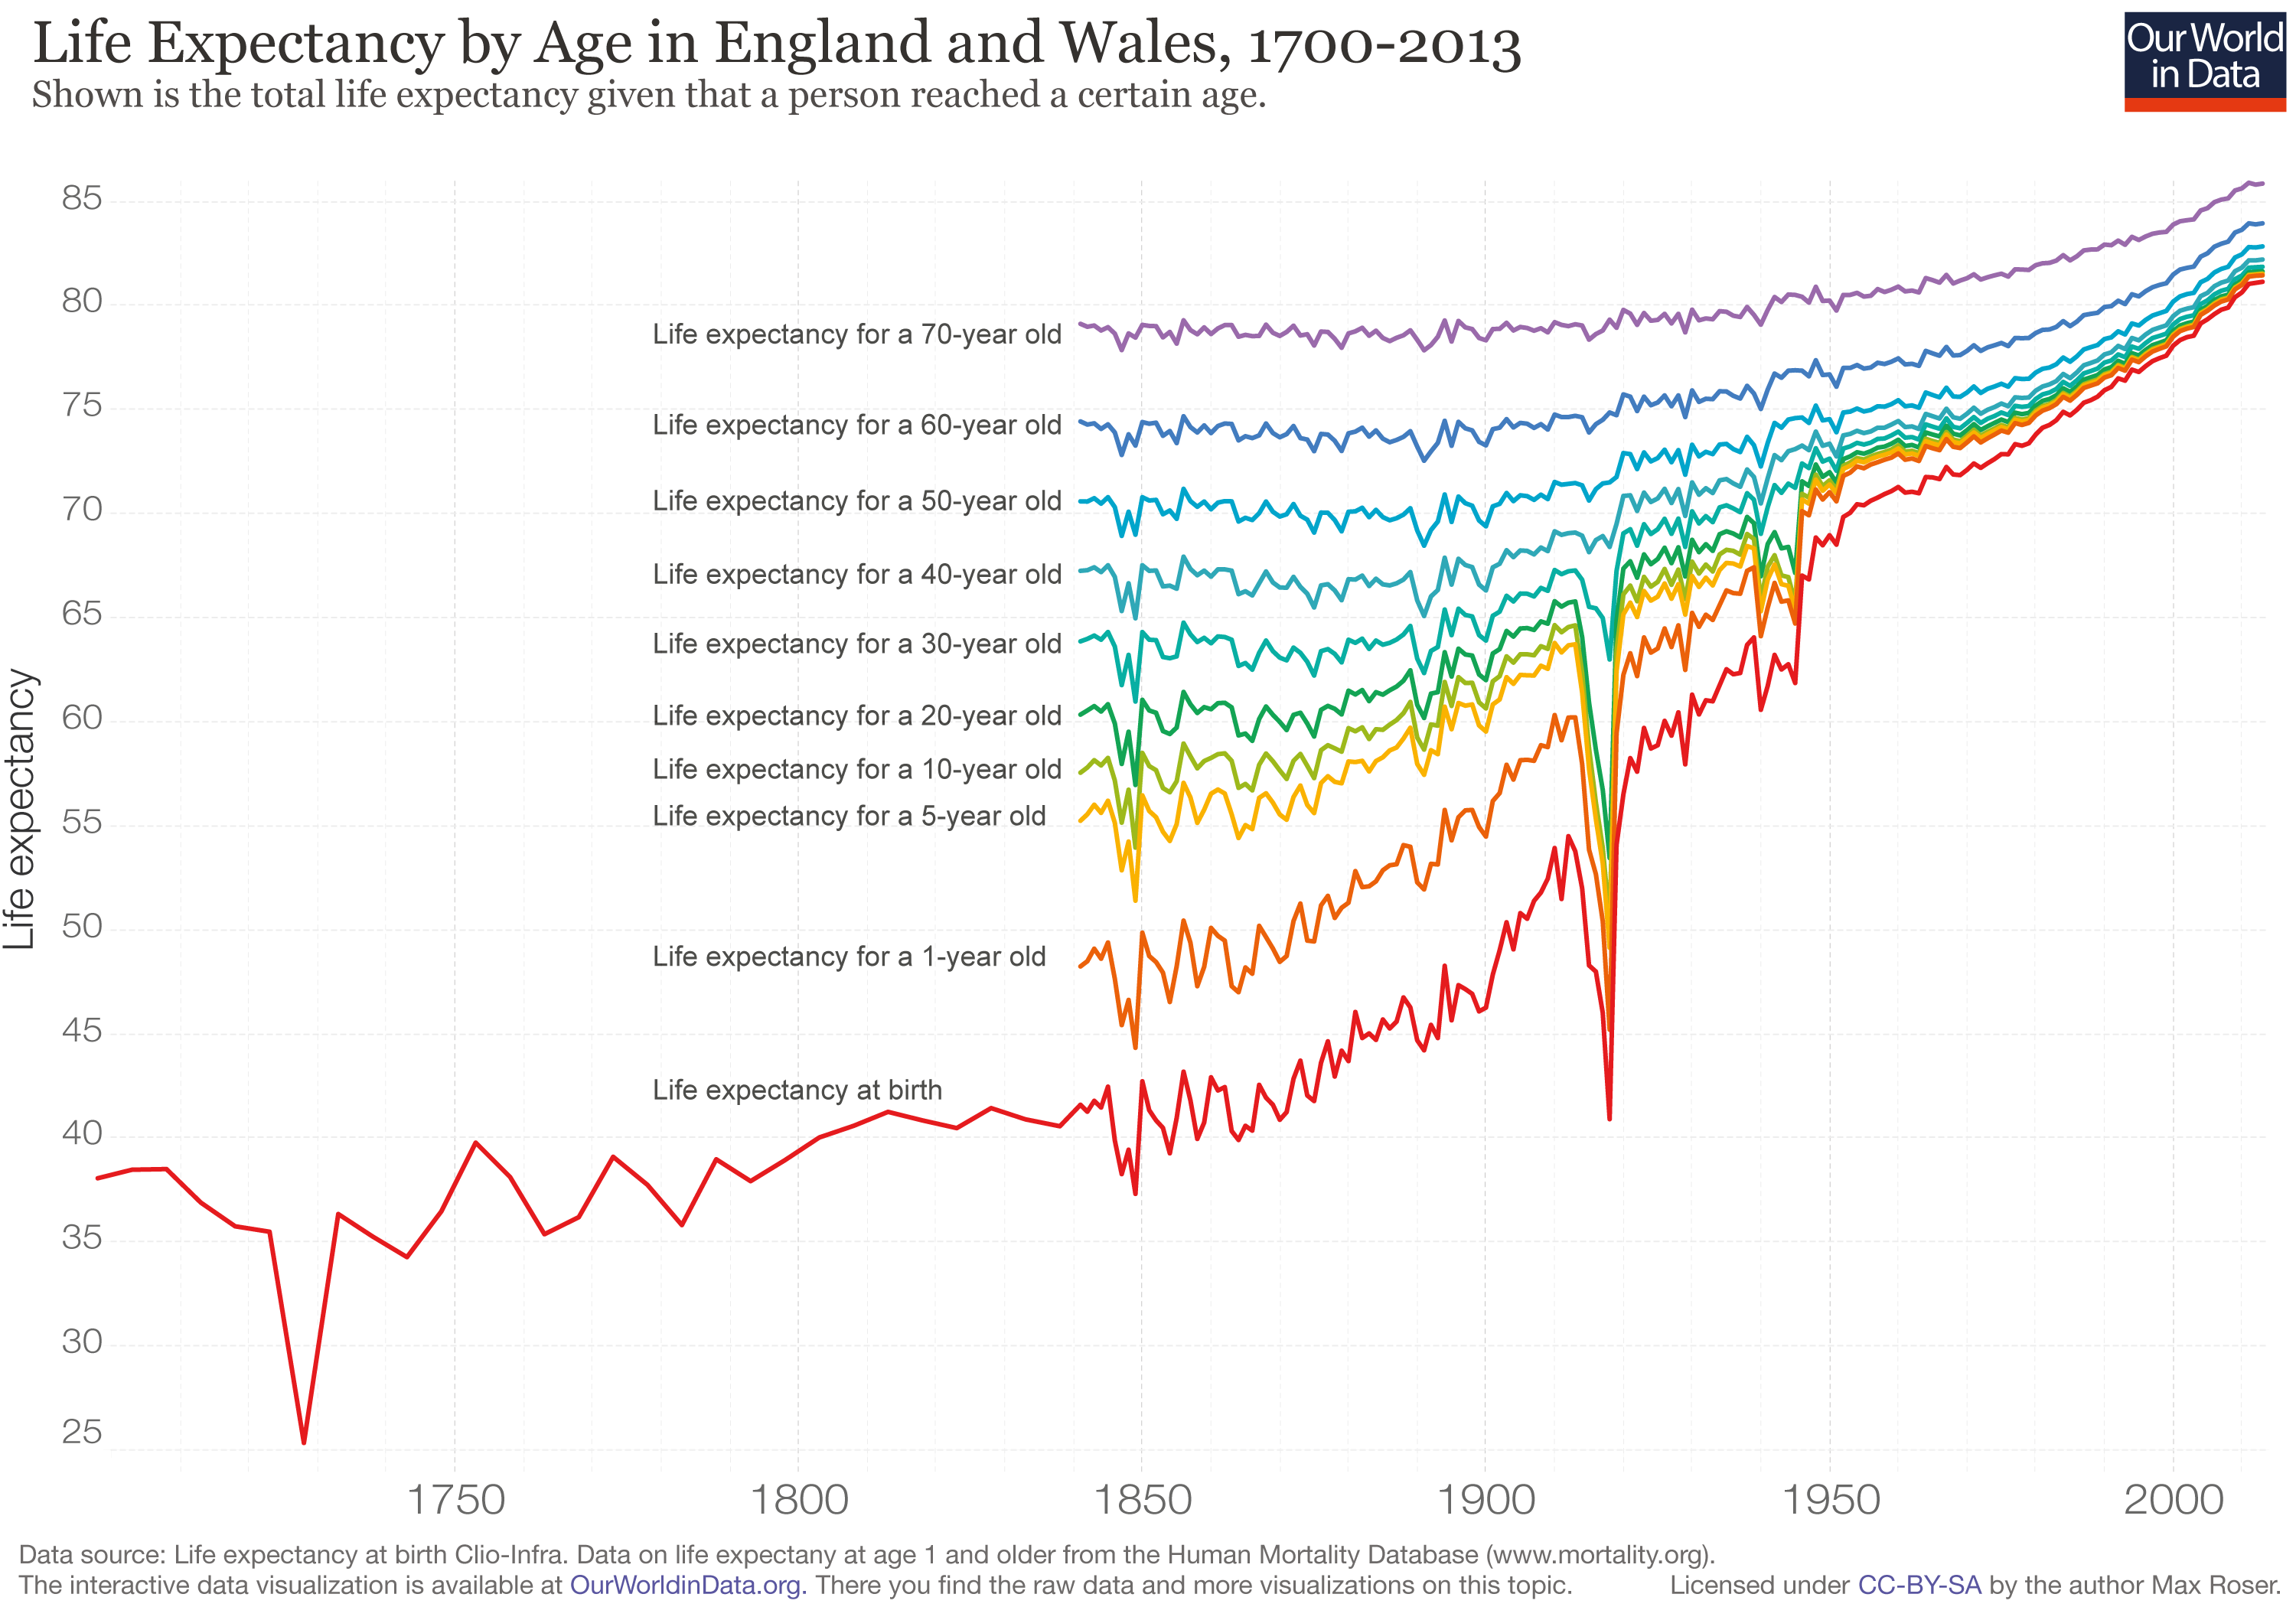
The Spanish flu, in particular the second wave, was different in that it killed a lot of healthy young people, quick. https://en.wikipedia.org/wiki/... Also this chart on life expectancy at various ages, in particular around 1918, https://ourworldindata.org/wp-...
-
Re:Irony
Ahhh... classical fear mongering - because you don't want to read statistics correctly and cherry pick date ranges or crime categories and count on the idea that others don't understand statistics either. There were more homicides in Germany during the 80s and early 90s. Overall, crime rates in Germany are fairly low. Moreover, for a fair comparison you'd need to take into account the age classes and incomes, too. Here is some more information on potential correlations between crime and immigration.
The vast majority of immigrants does not commit any crimes whatsoever, just like the vast majority of Germans don't. Increase living standards and education, and the crime rate sinks, too. Get more elderly or more female immigrants, and the crime rate sinks, too. Just like with Germans citizens without immigration background.
-
Re:Forms of Government will Change
More and more scarce?
https://ourworldindata.org/foo...
https://ourworldindata.org/wat... -
Re:Forms of Government will Change
More and more scarce?
https://ourworldindata.org/foo...
https://ourworldindata.org/wat... -
Re:We get that
The trouble with us here in America is that very, very little of our tax dollars make it back to us. More than half of them is just wars and servicing the debt from those wars. We aren't gaurnteed health care or an education for ourselves or our children.
Information on Public Spending. According to this the US spends more on public benefit expenditures than Canada. The US has a lot of social programs, they are just a patchwork of benefits that don't stand out as much as Canada's healthcare system.
-
Sequestration isn't the only option
Sequestration is only being explored because we don't want to pay the energy price to break apart the carbon dioxide. The entire reason fossil fuels are such a tempting energy source is that their CO2 and H2O end products sit at very low energy states, meaning burning the fuel to produce CO2 and H2O gives off a lot of energy. But if you're willing to dump enough energy into CO2, you can simply break it apart into oxygen gas and some other carbon compound.
Obviously it doesn't make sense to do this with energy produced from burning fossil fuels. But doing it with energy from renewable sources and nuclear power makes sense. Nuclear is the more interesting option since we already have the technology available to do this and know how to scale it up to the massive levels necessary to counter and even reverse CO2 emissions. We'd just need to construct more nuclear power plants.
Why don't renewables scale as well? Replacing a Fukushima-sized nuclear plant (4700 MW nameplate capacity, about 4200 MW after factoring in 0.9 capacity factor) with wind power would require something like 18.7 GW of wind turbines due to wind's lower capacity factor (0.20-0.25). That would require around 430 km^2 of land area based on the land use of smaller wind farms. (Using Fukushima as a comparison since I already did the math back in 2011. Incidentally, the Fukushima evacuation zone is only 371 km^2. And the land area occupied by wind farms in most populated climates is not habitable due to the danger of ice throws.)
This plant would produce (4200 MW)*(8766 hours/yr) = 36.8 TWh of energy per year. Since the world produces about 130,000 TWh from fossil fuels each year, you'd need at least 350 such plants to offset global CO2 emissions. Multiply it by 2 to factor in inefficiencies in the process. And you get (2*350)*(430 km^2) = 301000 km^2 of land area covered by wind turbines, or about the size of Italy. But it can't just be any land area, the land also has to have strong and consistent winds. Otherwise you'll need even more turbines and more land area.
If you used 1.5 MW turbines @ $3 million each, 12,500 such turbines would have a construction cost of $37.5 billion, which is more than what the nuclear plant would cost. Solar is even worse since its capacity factor is lower than wind's, and its cost per MW about 3-7x higher. Of course, planting trees is a whole lot cheaper, as long as you're willing to chop them down after a few decades and bury them in deep abandoned mine shafts, and re-plant them. -
Re:Gee, can't imagine why...
... seeing as how fewer than half of them will ever be able to pay off their college loans. Maybe if we want to prove capitalism can work for everyone we should stop letting rich people write all the laws?
So, you're saying the "free stuff" from the government didn't work, and the logical response is to demand more "free stuff"?
In order to "make capitalism work for everyone"?
Seriously? What part of capitalism in the US doesn't "work for everyone"? Where are the people actually starving? Where are the people who totally lack medical care?
Just because we don't have equality of results in the US does not mean "capitalism doesn't work".
Hell, given that everyone is different, how the hell do you get to equality of results anyway? The socialist style where everyone winds up equally poor (except for the rich...), like in Venezuela?
Capitalism doesn't work for everyone? What a load of bullshit.
Capitalism has, for example, dragged life expectancy worldwide way, way up:
Life expectancy has increased rapidly since the Enlightenment. Estimates suggest that in a pre-modern, poor world, life expectancy was around 30 years in all regions of the world. In the early 19th century, life expectancy started to increase in the early industrialized countries while it stayed low in the rest of the world. This led to a very high inequality in how health was distributed across the world. Good health in the rich countries and persistently bad health in those countries that remained poor. Over the last decades this global inequality decreased. Countries that not long ago were suffering from bad health are catching up rapidly. Since 1900 the global average life expectancy has more than doubled and is now approaching 70 years. No country in the world has a lower life expectancy than the the countries with the highest life expectancy in 1800.
Where'd that process start? Who drove it?
Oh, yeah - Western European capitalist democracies.
Gawd, that's gotta hurt a leftist ideologue, eh?
-
Re:Nuclear power is an obsolete heatload
Because that is your Nuclear Ideology, it is your ism, your belief system that wants to make us believe the sun stops shining and the wind stops blowing when it is hot.
That's not what I claimed and you know it. I stated that wind and solar have reduced output in a heatwave, just as nuclear power has reduced output in a heat wave. I suspect you know this otherwise you would have provided a citation on that. I did some searching and found that PV panels can see a 10% to 35% reduction in output in high heat. If you don't believe me then I'd like to see what you believe a more accurate number would be.
Solar Thermal is an immediate, viable, long term, economical and technologically underdeveloped base-load replacement for nuclear power.
Yes, I've seen that. The claim is that the sun can heat a molten salt, used to heat air in open or closed cycle gas turbines, do so without the use of water as a heat sink, and therefore perfect for use in hot arid climates. This allows for long term storage of energy (long term = hours or days, not months), load follow capability, as well as waste heat suitable for desalination and other industrial processes. I do not dispute this. Want to know why I don't dispute this? Because this exact same technology is what is planned for in future molten salt nuclear reactors.
https://en.wikipedia.org/wiki/...Go ahead, bring on the molten salt solar thermal power. That will prove the technology for use in nuclear reactors. You think energy storage only helps wind and solar? It helps nuclear power just as much, if not more. Here's where nuclear beats out solar on the molten salt storage, it doesn't take multiple square miles to achieve 1 gigawatt of power. It might take the area of a medium sized airport, but that's mostly to provide an ample security buffer around a vital civil asset, no different than that around a water reservoir, hydroelectric dam, or... well, an airport.
Domestic Solar is the perfect peaking solution to replace nuclear power. Wind is a new type of power generation mechanism with a vastly more dynamic upgrade cycle than anything we've see so far, it has massive promise to replace nuclear power.
I'll believe it when I see it. Since nuclear power provides 20% of the electricity consumed in the USA, and you claim that wind and solar are going to replace it, do I really need to provide a citation for you on the current viability of nuclear power? It seems you've admitted to that already.
Maybe it's more of your rhetoric. As you said of nuclear "they still produce power" the only difference is solar and wind don't explode and cause mass evacuations like a nuclear plant does when they overheat, they just make less power.
Wind and solar kill more people than nuclear. Citation:
https://www.forbes.com/sites/j...
https://ourworldindata.org/wha...If you want to reduce nuclear accident deaths further then stop evacuating people needlessly. Citation:
https://www.nbcnews.com/news/w...Unlike Nuclear power, wind and solar plants are upgradeable.
Then explain this list of articles on nuclear power plants getting upgrades:
https://www.power-eng.com/nucl...Unlike Nuclear, coal and everything else developed in the 19th and 20th century that produce heat, solar and wind is a 21st century solution that reduces the heat load
-
Re:Blah blah blah
Nuclear energy is not safe and is not inexpensive when humans are involved.
It's safe...
https://ourworldindata.org/wha...
https://www.nextbigfuture.com/...It's inexpensive...
https://www.eia.gov/electricit...
https://insideclimatenews.org/...
https://www.forbes.com/sites/j...Decommissioning costs are running two orders of magnitude more expensive than proponents said they would be.
* This means that nuclear is actually much more expensive than it's stated cost and that means the next generatiosn subsidizes nuclear power used by the prior generations.That's just a lie. The Forbes article above explicitly point out that decommissioning costs are included in the price. They also point out that past cost overruns in nuclear power were often the result of poor money management, not any flaws in the technology or construction.
Securing the nuclear waste costs millions of dollars per site per year for the foreseeable future.
* This cost increases over time. What cost $6 million 10 years ago, costs $8 million a couple years ago.Prove it.
Private insurance will not cover the risk. That's evidence right there that the risks are unknowable or larger than proponents say.
* This means citizens are on the hook for unlimited losses. Corporations and executives get the profits up front and dump the costs on citizens.The risks are large. That's what happens with any large project. A multi-billion dollar anything will be more than any private insurance company is willing or able to cover. This is a financial risk, which again is often a problem of poor money management and not any flaw with nuclear power itself.
It has benefits for CO2 but we sail thru the 2 degree celcius increase about 2024. Nuclear plants wouldn't be done for 20 years.
Mean construction time for a nuclear power plant is about 7.5 years, though many have been completed in 3 years. Just because the TVA took 42 years to complete a reactor at Watts Barr does not mean all reactor projects are doomed to take as long.
The public hate them.
That's changing.
https://www.statista.com/stati...
https://www.thedailystar.net/o...I've seen people flip on their stance on nuclear power right before my eyes when I point out that Fukushima was older than Chernobyl. We don't build nuclear reactors like Fukushima and Chernobyl any more. People understand this. You can complain about nuclear being unsafe, too expensive, and so on, but that's technology from 1980 if you are lucky. I can make wind and solar look bad too if I'm taking state of the art from 1978 and compare that to modern nuclear. Should I base my car purchases from what I learned by reading Unsafe At Any Speed?
I could see using Nuclear only in extreme lattitudes where alternative energy is less practical.
Then you need your vision checked.
-
Re:Stop reproducing
If we can educate the poor and make them part of the first world or at least a lot closer: population growth would be a solved problem.
At the moment we are at 7 billion people on this planet and looks like 9 or 10 is were we are going to end up.
Supposedly we've already almost reached peak child: https://ourworldindata.org/pea...
-
Re:China to America
How many hundreds of thousands have died from fossil fuel "incidents", compared to the nuclear fatalities you can count on your fingers?
That is a lie, and you are a liar. Chernobyl killed/is killing at least 4,000 people (according to the lowest credible estimate) and Fukushima will have killed at least 400 people due to radiation exposure, not to mention the 1,600 who died due to the evacuation. You have to count those people, because they only had to be evacuated because it was a nuclear plant. If it had been any other kind of plant except maybe liquid sodium solar thermal, it would not have been necessary. (You wouldn't want to be around a containment failure in one of those during a flood!)
You're also engaging in the logical fallacy of false dichotomy. Fossil fuels are also dangerous and wrongheaded. There are ways to generate power other than fossil or nuclear. HTH, HAND!
-
Re: How surprising,...
Except the stats don't back up the 'sky is falling' position...the world is much better now than ever before. And it is much better for the poor than it was before.
I, for one, don't miss polio, small pox, massive deaths in wars, and a lack of access to information.
Leftist, centrist, rightist...the one thing they all have in common is they are pessimists. Put on some Louis Armstrong, enjoy the sun, and then make the world even better for the future.
-
Re:We're closing a nuclear plant nearby
Unless you were being facetious, you're wrong. Nuclear is actually the safest of major energy sources.
The first flaw in the argument you present is that it assumes that the Fukushima and Chernobyl disasters are under control when they are not. Flippantly the article discards the destruction of the residents community as "induced stress from the evacuation process" whilst ignoring the other vectors of transgenic disease and pregnancies that fail to come to term.
The second flaw in the article is there is no metric to quantify the damage to the human genome caused by nuclear power as the mechanisms that cause damage takes a long time for people to study and understand. The nuclear industry relies on this complexity to propagate idealistic thinking about nuclear power.
The third major flaw is that time is required to collect data and see the outcome of these nuclear disasters. I have not seen a reliable source of data on the propagation of radio isotopes in the environment and the IAEA's role is to promote nuclear power so its data cannot be trusted. You can look into their charter if you want a citation.
The fourth major flaw is the IAEA has interdiction orders over WHO publications so the WHO's findings on all things nuclear has to be viewed through the same lens you would observe any PR effort. This is an interstitial agreement between the two organizations named WHA12-40 was signed in 1959.
Folks with an idealistic view of Nuclear power are prepared to forgive or paint over the transgressions of the nuclear industry while most of the rest of the population takes a more pragmatic view and simply remembers how many times the nuclear industries claims have been proven false.
Solar, Wind and Geothermal are technologies that continue to evolve at a much faster pace and a much faster ROI than is possible with nuclear and when they fail they don't make thousands of square Kms uninhabitable which is why many communities see this as a better option.
All the best and I hope this brings some clarity to this extremely polarized debate.
-
Making up scary numbers
I call complete bullshit on your pulled-out-of-your-ass $50T costs figure. Cite it, or shut it.
Cost estimates of actions to mitigate the worst of climate change depend on the action (many, like efficiency improvements and insulation, actually save money), but a reasonable and effective (and genuinely researched) mitigation program suggests about €200-350 billion per year by 2030 - in total that's dramatically less than $20T in climate adaption costs, as virtually all economic reviews have concluded (q.f. the Stern, McKinsey, and Garnaut reviews in particular).
-
Re:We're closing a nuclear plant nearby
Unless you were being facetious, you're wrong. Nuclear is actually the safest of major energy sources.
-
Re: Anti-LGBT ??
True, but what that means is that other folks should always be looking for other theories that might better fit the data. Unfortunately, most of the folks on the other side seem to think that "unsettled" means "I can ignore this because it is inconvenient," which is not the same thing.
No, not at all. That's the strawman constructed and attacked. Go check out Watts Up With That, and you'll find 99.9% of the posters acknowledge some warming, but are skeptical that it is all man-made and it all comes from CO2. Rather, the appearance of trends as I linked tend to show a high likelihood that much of the warming is natural. So perhaps we need to re-think our priorities and budgetary allocations based upon data, rather than models that simply do not match the real world.
The problem is that their alternative explanations only fit the data over a very short period of time [skepticalscience.com], geologically speaking. These theories have been debunked repeatedly by trivial comparison with the actual data.
Actually, no. Not a single IPCC model accounts for the rise of temperature from 1890 to 1940, then the plunge from 1945 to 1975, let alone the general pause in the 2000s. However, there are models that correlate nicely with the past and also have predicted - more reliably than the IPCC models - the current 2000s. They come from geologists, though, not from climatologists. In fact, looking at past inter-glacial periods, we see a continual cyclic pattern of ever-increasing temperatures until the entire system "flips" into deep cooling. In other words - what we see today, is not unprecedented.
That said, there's a lot we don't know. It is possible (nay, almost certain) that we will eventually hit an equilibrium point at which more plants are growing, and the temperature change levels off.
When it levels off, that's when it starts falling. A few hundred million years says that's the way it happens. Typically glaciated over most of the Northern hemisphere, with occasional blips of warmth - like we have now.
The big unanswered questions are how many major cities will be underwater when it does, whether we will have enough arable land to feed the earth's population as temperatures and rain patterns shift, and whether the cost of reducing our greehouse gas emissions exceeds the cost of dealing with the effects of climate change over the long term. And *that* is where there is a lot of room for speculation, debate, etc.
Sea levels historically happened 4X faster than now, food production is skyrocketing, and there still isn't any real effect from increasing CO2.
Rather than sweat over something that has NOT been shown to be a cause of disaster (CO2 increases driving climate change), I fully agree with Bjorn Lomborg that we should look to spend our money on real, defined, understood problems.
-
Re:Externalized Costs
The model does not include the cost of nuke plants that melt down, even though we know they do that periodically.
Come on, man, this is just blatant FUD. "Periodically" meaning 3 real incidents, EVER. Compare deaths from nuclear to constant deaths from solar (workers falling off roofs), wind (workers falling of turbines), hydroelectric (workers falling off dams, dams failing and wiping out entire towns), natural gas (workers dying in fires), coal (workers dying in fires AND dying in mines AND bystanders dying from lung disease), and you see that nuclear is far and away the safest energy source out there. Three completely separate references for you, all of which concur:
https://www.nextbigfuture.com/...
https://ourworldindata.org/wha...
https://www.forbes.com/sites/j...There are a few good reasons to be wary of nuclear - frequent schedule/budget overruns being chief among them. There's also a huge cost for facility decommissioning that hasn't really been handled adequately. But safety concerns are outright lies - nuclear energy is literally and provably the safest form of energy that exists. That argument is bad and you should feel bad for making it.